Have you ever felt that justifying your detention design to a reviewing agency was a game of numbers? Do you have ways of making that marginal design look like a winner? Most engineers do. After all, hydrology is a science of guessing the future, and it has been shown time and again that the accuracy of these guesses can be very poor. Then, there is often doubt whether small site facilities actually provide a net benefit over a large regional watershed. These points, and others, provide more than enough leeway to be flexible with the numbers.
Detention computations have lots of room for play. In my 12 years as a reviewer approving calculations, I have seen just about everything, from manual calculations on loose-leaf notebook paper to weighty computer printouts hundreds of pages long. Some are filled with fancy graphics and pretty prose, and others contain only a result and a seal. All engineers tend to have their preferences, and after breaking their secret codes, I can usually reduce each design to four basic elements: (A) the site hydrology before development, (B) the site hydrology after development, (C) the proposed detention facility, and (D) and the attenuated flow from the site.
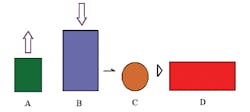
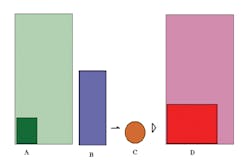
In my efforts to simplify these calculation elements, I have a simple diagram system to show the basic steps (Figure 1).
Each element has a certain volume, represented by its area in the diagram. Each rectangle is a volume of water whose height is proportional to its peak flow rate and whose length is proportional to its time of flow. Item A in green is the flow before development. Item B in blue is the flow from the developed site. Item C is the detention facility, which changes the shape of B to D.
Most regulations require only that D be shorter than A (or have a lower flow rate). The real magic is in how you get there. Most reviewing agencies will require that the designer demonstrate how D was achieved. In many cases this is a simple matter; calculations show the site draining to a proposed facility and the facility draining out, and all the numbers have a source and a good reason. In other cases, it is not so simple, and clever manipulations have been necessary, often with black-box computer programs to hide the details. But after we get past the sophomoric strategies of hiding information by outright omission, or by snowing the reviewer with mountains of paper, we get to some real items of debate. Tongue in cheek, these are the cheats.
Cheat 1: Fudging Peak Flow Rates
Playing with the computation of peak flow rates (items A and B in Figure 1) is the most obvious and probably the most popular way to cheat. Sometimes called “voodoo hydrology,” this practice of using numbers just a little higher or a little lower than normal is easy to do, and given the inherent inaccuracies in the various methods, as well as a large discrepancy in source materials, it is hard to refute.
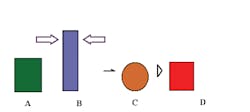
The objective is to increase A and decrease B (Figure 2).
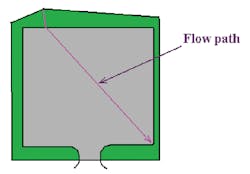
The best way to do this is to increase or decrease your time of concentration (or lag time, or travel time) by use of the flow path. This can be done with most any hydrologic method that allows the designer to break up areas and flow paths. The Rational Method is used in these examples for brevity. (This level of detail in a computation is only necessary if the regulator asks for the flow path. In my experience, most computation packages do not show this step. They simply throw in a time, high or low. But let’s assume we must use all the steps.) I will illustrate this with the example of a 1-acre wooded site to be developed into a parking lot (Figure 3).
I will use the flow path to decrease B, the flow, from the developed site. I will do this by use of sheet flow. Sheet flow time dominates the hydrologic calculation for most small watersheds. The manipulation of sheet flow time is key.
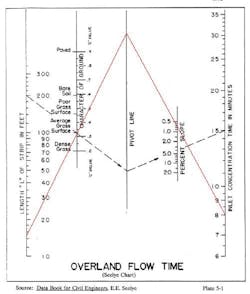
At the top of this example lot, there is a small grass strip of 0.2 acre. If I consider this in the flow path, using one of my favorite old dinosaurs, the Seelye chart, I might add eight minutes to my time of concentration (Figure 4).
This will change the peak flow significantly, whereas if we did not use the grass strip and even reduced the area accordingly, we would get a larger (and more representative?) number. These are the results using the Rational Method and an IDF curve for a 10-year interval storm in Albemarle County, VA:
Without grass strip:
Using 10 min., C=0.9, and 0.8 ac.: CIA = 0.9(5.4)0.8 = 3.89 cfs
With grass strip:
Using 18 min., C=0.77, and 1.0 ac.: CIA = 0.77(4.2)1.0 = 3.23 cfs
This result is counterintuitive. Usually a larger area yields more runoff, which makes this a convincing cheat. Be sure to point out you have “conservatively” used the larger area. In this case, it allows us to decrease B, the flow after development, by about 17%. Combined with careful manipulation of the flow before development, we could double this percentage.
Now that I have decreased B, I will seek to increase A, the flow before development. I could simply reverse the logic above and alter the flow path the other way, but instead I will use another favorite method of fudging the peak flow rates: increasing or decreasing the runoff coefficients. This method is more easily noticed but often works simply because the sources are so confused. This is because textbooks are not concerned with consistency but rather with accuracy, which is dubious at best. In my example I will use the rational coefficient (C). For a wooded site in Virginia, we can find the following quick sources for C:
- State stormwater management handbook (p. 4-20): 0.3
- State erosion control handbook (p. V-29): 0.05-0.25
- Virginia Dept. of Transportation Drainage Manual (App. 6E-1): 0.3
- Civil Engineering Reference Manual (p. 6-24): 0.059-0.2
This is a wide range. I can certainly justify the maximum of 0.3, and if I have a gravel drive, old shed, or something similar, I might be able to compute a composite value up to 0.35.
It is easy to see by these examples that fudging the peak flow rates is easy and can yield great results. What may not be obvious is the way detention design takes the normal ideas of conservatism and turns them upside down. Remember, most hydrology was developed long ago to get a peak flow rate for the design of a pipe or culvert. If you generated a number that was too high, and you put in a pipe larger than you actually needed, all was copacetic. The design was conservative. But if you generate a number that is too high in your detention design, especially at point A (the flow before development), you end up with a higher release rate and a smaller facility, which is not conservative.
Cheat 2: The Puddle Storm
This next cheat involves the remaining steps in developing hydrographs. Instead of playing with the peak flow rates, we are going to play with the storm runoff volumes. Using our diagram, our main objective is to shrink B, the flow produced after development. Regardless of the peak flow rate, the water volume must be less. We want the diagram to look like Figure 5.
As with all these cheats, this will have the effect of reducing C, the size of the basin, significantly.
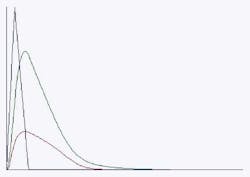
Volumes of runoff from storms are usually just assumed with the hydrograph shape. The two most popular examples, which are used almost exclusively in site design, are shown in Figure 6.
Triangular approsimation of SCS unit hydrograph (used with Rational Method)
SCS Type II 24-hour distribution user with most SCS (NRCS) methods
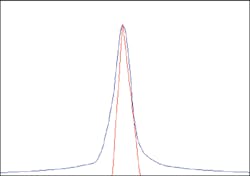
As with the peak flow rates, there are many sources that debate the accuracy of these distributions. Most say they are too large and too intense. Therefore, our cheats should actually compensate for these defects. Regardless of accuracy, our main objective is to use the hydrograph shape with the lowest volume (area under the curve). At the same scale and the same peak flow, the better choice is always the triangular unit hydrograph, as is easily shown by a direct and scaled graphical comparison (Figure 7).
If this is acceptable, the volume of the storm will be a fairly fixed value based on the peak flow rate (SCS methods vary). More significantly, the volume will be very small if the peak flow rate is very small. This conveniently ignores the fact that the typical rainstorm may generate a lot more runoff. For instance, using our parking lot example, assume we get a peak flow of 4 cubic feet per second (generously rounded up to make the regulators happy). The triangular hydrograph will give us about 0.9 inch of runoff in our 1-acre watershed–little more than puddles. On the other hand, reliable sources tell us we should get almost 6 inches of rainfall for a 10-year-interval storm (in Albemarle County, VA). I say “almost 6″ because some of the rainfall will not run off, but that is really not much in this case.
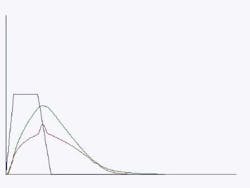
Many agencies have now gotten smart to this cheat, and the Modified Rational Method is one attempt to address it. In addition to the peak flow triangle, other hydrographs with extended peaks and greater volume are required. Figure 8 shows hydrographs plotted at intervals of two minutes for our example 1-acre parking lot site (notice the peaks follow the IDF curve).
If you compute the volumes under each hydrograph, you will see that the volumes increase indefinitely. However, we hope at some point the detention facility will be releasing water as fast as it flows in, so a limit will be reached. For most facilities this occurs somewhere between 20 and 40 minutes. We’ll be generous and use 45 minutes, where the volume of the hydrograph is approximately 4,400 cubic feet, which equates to about 1.2 inches of runoff over our example site. This is still nowhere close to the 6 inches of rain we should have. So, given the usual choices, the natural cheat will almost always be the triangular hydrograph shape, even with the modifications for more volume.
Why do I say almost always? The catch to this method occurs when you have a large facility with a continuously slow release rate. The design will not soon reach the limiting point where the release rate equals the inflow rate, and because the extended hydrographs always increase in volume, they will grow beyond what is reasonable for a design storm. You will be filling a slowly leaking bowl until it overflows.
Cheat 3: Washout at the Point of Analysis
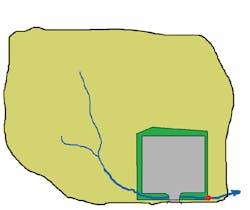
This cheat involves using offsite areas in your analysis. If you use an offsite area that is large enough, the timing of hydrograph peaks will hide your site discharge. For example, let us say our parking lot is part of a larger 25-acre watershed, which drains to a stream just off our property (Figure 9).
When comparing flows before and after development (diagram elements A and D), a point in the stream at the corner of the property is a natural place to do this. (After all, the reason for the detention facility is to protect the stream from erosion and downstream flooding.) We have shown this point in Figure 9 with a red dot.
If we consider only our site, we might arrive at the following 10-year peak flow values, also represented in diagram form (Figure 10).
- A (before dev.) = 0.3(4.5)1 = 1.35 cfs
- B (after dev.) = 0.8(5.4)1 = 4.32 cfs
- D (detention discharge) = 2.7 cfs
This does not appear to work (D > A). But, if we look at this from our chosen point of analysis, we get the following values:
- A (before dev.) = 0.3(2.94)25 = 22.05 cfs
- B1 (after dev.) offsite = 0.3(3.5)24 = 21.17 cfs
- B2 (after dev.) onsite = 0.8(5.4)1 = 4.32 cfs
- D (onsite detention discharge) = 2.7 cfs
Using these results we then add the two hydrographs, B1 and D, together (Figure 11).
Sum: B1 + B2
Hyd1: B1 offsite
Hyd2: B2 onsite (routed)
Now it works like a charm. The new peak is 22.05 cubic feet per second. There is no increase in runoff at our analysis point. We have taken full advantage of the different times to peak. In fact, this cheat works so well, we did not even need to provide a detention facility at all. We could simply have added the onsite flow after development, B2, to the offsite flow, B1 (Figure 12).
Sum: B1 + B2
Hyd1: B1 offsite
Hyd2: B2 onsite (routed)
Our result would be 21.17 cubic feet per second, even less than before! Figure 13 is a summary of what we have done in diagram form.
Now, some agencies have sort of caught on to this cheat. For instance, take the Virginia Erosion and Sediment Control Regulations for adequate channels. These regulations state that no analysis is necessary if the site is 100 times smaller than the contributing watershed. In the case of this example, it is off only by a factor of four. I have found that using a drainage area even 50 times larger becomes absurd, but not all people see it that way.
Cheat 4: The Conservative Culvert
This cheat involves hydraulic assumptions. It makes use of the classic culvert equations from the Federal Highway Administration’s Hydraulic Design Series number 5. The example I will use in this case is a lonely road culvert sitting downstream of our site. I can show that this will serve as an adequate detention facility because it holds back enough water to account for the increase from my site.
There are three common ways to model the hydraulics in a facility like this: (1) as a pipe using open-channel flow or hydraulic grade lines, (2) as a culvert, and (3) as an orifice. Each will give different results. For instance, Figure 14 shows the varying depths of flow using a 15-inch corrugated metal pipe at a flow of 5 cubic feet per second and a slope of 1%.
Various depths for 5-cfs flow
Conversely, here are the varying flow rates at a consistent depth of 15 inches:
- Pipe 8.4 cfs
- Culvert 4.1 cfs
- Orifice 4.8 cfs
I conclude that the culvert equations will show that less water is let through and more held back than the other hydraulic assumptions. Better attenuation will be achieved by the culvert assumption.
As we remember the discussion of conservatism in cheat 1, it is easy to see that we are turning over the classic concept of conservative design once again. When the empirical equations for culvert flow were developed, a conservative result was a higher headwater, holding back more water. If you assumed the pipe held back more water than it actually did and you wanted to reduce the depth of that water, a larger pipe was the result. This was conservative. Thinking in terms of detention, the reverse is true. If we are not actually holding back as much water as we compute, then we will not get the attenuation we want. Water passing through the system faster is not a conservative result.
This cheat can also be used in reverse. If a smaller facility is desired, the culvert equations should not be used. Less water will be held back, but the discharge rates will likely be higher.
Cheat 5: Overcompensation
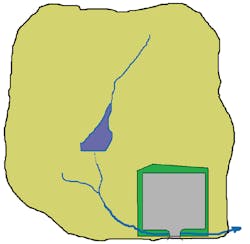
This cheat involves using an upstream facility to demonstrate that attenuation has already been provided for the downstream site. We must show that the upstream facility overcompensated for our increased runoff. This works best with large regional facilities. As an example, let us say a pond existed in the upstream watershed from our parking lot site (Figure 15).
We might find that the pond was conservatively designed, in which case it will already hold back the few cubic feet per second that we need. If not, we may find it was built larger than needed, and the control structures can be modified to hold back more water. Lacking these possibilities, we may find we can refine the design computation to show the pond does indeed perform better than previously thought. Naturally, this can be combined with the other cheats. Most large basin or pond designs will have plenty of wiggle room, if only by virtue of the inherent lack of precision in hydrology.
The overcompensation cheat also works more directly, provided your site is in the watershed of a large lake or pond. I have seen sites get credit for this even though they were half a mile upstream of the regional facility.
Many sites will have more than one detention facility. The overcompensation credit can then be traded like gold. Proposals can be made to detain more on one side of the site and get credit on the other. Trading with other nearby sites becomes possible, and some localities will even extend this trading concept to water-quality (as opposed to -quantity) benefits. (In the previous example of the upstream pond, if the credit from the pond was used without permission from the upstream owner, you might say it was “detention piracy.”)
This cheat has close similarities to cheat 3, the washout point of analysis. However, like cheat 3, a balance must be struck lest the comparisons become absurd. How big an area can be credited using overcompensation? How much of an effect do all these small detention facilities really have on the river 3 miles downstream? Questions arise about the site’s downstream channels and about responsibility and maintenance of facilities. To their credit, regulatory agencies struggle with these intuitive doubts, but, like the washout point of analysis, the numbers appear to work if the larger watershed is considered.
Cheat 6: Insignificant Additions
This cheat involves taking advantage of regulatory limits through phasing and so-called common sense. Most regulatory agencies use a threshold at which detention is required, usually about 1 acre. If a small site can be built in increments less than the threshold, detention facilities can be avoided. Often phasing limitations exist, so this does not work, but sometimes creative property divisions and changes in ownership will circumvent even these.
Often large institutions can use this cheat by appealing to the common sense of regulators. Schools, hospitals, airports, and similar sites will make small changes continuously–things like adding a few parking spaces, a drop-off lane, or even a small building addition. None of these little improvements is really large enough to warrant the construction of detention facilities. A well-fudged hydrologic computation of the entire institution will serve to point this out, especially when the composite runoff coefficients are not significantly affected.
The cumulative affects of incremental growth are often cited as reasons to build a detention facility. However, the locations of the incremental additions are rarely centralized, so capturing them is not always easy, unless one agrees to capture older areas that may be grandfathered or unregulated. The best option in this case is to reclaim old impervious areas. If there are older unused impervious areas that can be demolished or landscaped, this may offset concerns enough to substitute for detention.
Cheat 7: Fudging Volumes
This cheat involves taking advantage of the degrees and direction of error in the different methods of computing basin volume. The objective is to use the method that computes the largest volumes, making the basin seem as large as possible. There are primarily three volumetric computation methods used: (1) the average end area method, (2) the prismoidal method, and (3) direct geometry. It is noted that the prismoidal method is also known as the conic method or the frustum of a pyramid method, all of which are variations of the same formula. Likewise, the average end area method is sometimes called the double end area method.
Naturally, if we have a manmade structure like a pipe or box, direct geometry will be the most accurate. Otherwise, it is impossible to use. The other two methods are used almost exclusively, even when the design involves a manufactured structure. Of course, I am not interested in which of the three methods is most accurate. I am interested in how they work with a detention or reservoir routing and how they can be used to cheat.
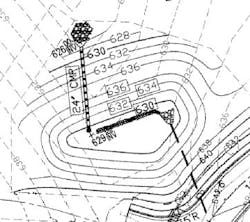
The first two methods make use of the areas inside elevation contours on plans. Casting aside the dubious practice of “approximating,” or rounding up these contour areas, the methods themselves can yield very different results. To demonstrate the difference I have used the basin shown on this contour map (Figure 16).
In Table 1, each of the contour areas is given. Next to these areas are the volumes computed by the two methods.
| Table1 | ||||
| Elevation (ft) | Depth (ft) | Area (ft2) | Volume by average end area (ft3) end area |
Volume by prismoidal (ft3) |
| 630 | 2,790 | |||
| 632 | 2 | 5,078 | 7,868.00 | 7,754.66 |
| 634 | 2 | 7,142 | 12,220.00 | 12,161.48 |
| 636 | 2 | 9,877 | 17,019.00 | 16,945.27 |
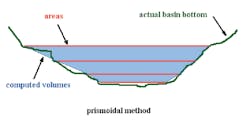
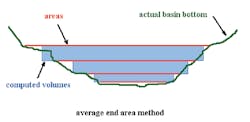
The average end area method clearly provides the largest volumes at any given depth, making it the method of choice for designing a smaller (cheaper) facility. Using this method will allow more reservoir storage, making for lower depths and more flow attenuation. This makes sense if we look at a picture of what the formulas are doing; one uses average sizes, and the other uses linear approximation (Figure 17).
Another technique used in computing volumes is to use an estimating formula instead of a detailed reservoir routing. Surprisingly, many agencies accept these. For example, the Modified Rational Method discussed with cheat 2 has a popular formula for estimating maximum basin volume (Equation 1).
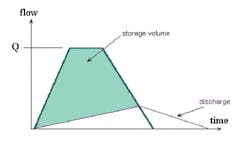
This formula is based on an assumed discharge shape, which looks something like the diagram in Figure 18.
The discharge shape for a specific design may or may not resemble this triangle. It is usually curved above the straight line approximation, as shown. What is important to note is that for most basins, if used properly, formulas like these overestimate basin volumes. They are not good cheats. They will give a larger basin volume than an actual routing. For example, using the basin above to drain a 13-acre development, the formula calls for 59,098 cubic feet of storage. The actual basin routing uses a volume of 28,998 cubic feet. The inflow and routed hydrographs for peak and critical duration storms are shown in Figure 19.
Routing: post dev captured Water EL 634.380
Discharge 9.538
Inflow 40.269
Routing: post dev captured Water EL 635.143
Discharge 12.707
Inflow 20.400
As you can see, the discharge hydrographs do not resemble triangles. The formula given to find volume using the Modified Rational Method should not be used. Not only can it miss on the critical duration storm, but also, as shown here, the resulting volumes can be way off.
There is a similar basin volume calculator that accompanies the old dinosaur, TR-55. Similar to the peak flow methods in that Natural Resources Conservation Service/Soil Conservation Service reference, it tends to give results that are overly large. Using the same example of our 13-acre watershed, with as much cutting corners as possible, TR-55 yields a required storage volume of 58,022 cubic feet. This is very similar to the Modified Rational Method result but still twice as much as needed. The result is the same; do not use volume estimating methods, unless you are trying to enlarge a basin.
Cheat 8: Infiltration, Pore Storage, and Water-Quality Volume
This cheat is used most often in conjunction with water-quality facilities, such as porous pavers, biofilters, sand filters, or just porous soils and gravel layers. The objective is to obtain credits toward storage or reservoir volume, thereby making the required volume in the actual detention reservoir smaller.
As an example, an underground storage tank is proposed under our example 1-acre parking lot, and next to it, we have a concave parking lot island used for water-quality filtering and plantings (Figure 20).
This storage tank would normally need to be about 93 cubic yards, or 200 linear feet of 48-inch pipe, for our detention design to work. However, we can point out that the concave islands will store a certain volume of water that never runs off the site. Depending on the water-quality design requirements for the site, this will be between 0.5 and 1 inch of water over the contributing drainage area. Assuming we are capturing half of the parking lot in similar islands, this will reduce our volume by at least:
(0.5 in./ft./12 in./hr.)(0.5 ac.)(43,560 ft.2/ac.)/(27 ft.3/yd.3) = 33.6 yd.3
This is a large portion (about 30%) of the required detention volume and so a difficult issue for regulators. Many agencies do not allow the use of this water-quality volume in the detention analysis, even when it is in the same basin. If it is allowed and needs to be routed, it can be subtracted out of the initial post-development hydrographs.
It is worth noting that this consideration helps out with one of the most common pitfalls in underground detention facility design. Capturing more runoff initially lessens the risk of the inlet collection system (grate and curb inlets in the parking lot) overflowing. In other words, when inlets are designed to a lesser standard than detention facilities, water may not even reach the detention reservoir during the design storm. The danger of this is reduced.
Continuing with our volume considerations, it is common for designers to want to consider the infiltrated water, but the infiltration rate is really not enough to matter. A modest infiltration rate would be 0.5 inch per hour (at least 0.5 inch per hour is usually desired for practical infiltration). With our basic hydrology, we can assume this will occur for at least three times the time to peak of our hydrograph, or 0.5 hour. Assuming the areas of our islands are at least 2.5% of the 0.5 acre draining to them, which is a minimum standard in Virginia, this comes to:
(0.025)(0.5 ac.)(43,560 ft.2/ac.)(0.5 in./hr./12 in./ft.)(0.5 hr.)/(27 ft.3/yd.3) = 0.42 yd.3
This is not really worth consideration. So, discounting infiltration, it is common practice to import 2 to 3 feet of organic sandy soils for the filter. This soil will have pores and a volume of storage associated with them. Reliable sources indicate as much as 30% voids by volume in sand. Using 2.5 feet of imported soils and a conservative 20% void ratio, we get a volume of:
(0.025)(0.5 ac.)(43,560 ft.2/ac.)(2.5 ft.)(0.2)/(27 ft.3/yd.3) = 10.08 yd.3
An underdrain containing 1 to 2 inches of gravel could be accounted for in the same manner, but I won’t bother with that here. In Figure 21, the areas of sand and gravel I am using are labeled.
This technique has already cut our required detention volume almost in half, down to 49.3 cubic yards, and it is still possible to go further. Normal construction practice will necessitate that our underground tank be placed on a compacted bed of gravel or sand. We will assume gravel, which is more common. Gravel can reasonably be assumed to contain up to 40% air voids. If we provide for a porous bottom and 1-inch depth of gravel, conservatively using 30% voids we can account for an appropriate volume of:
(4 ft.)(100 ft.)(1 ft.)(0.3)/(27 ft.3/yd.3) = 4.4 yd.3
In total we have reduced our tank by 48 cubic feet down to 97 linear feet of pipe.
Cheat 9: Channel Storage
Channel storage is a popular cheat but of only marginal value. Most sites will have ditches, pipes, inlets, and other structures for handling the conveyance of stormwater runoff. The objective is to use these existing conveyance structures and areas for storage (Figure 22).
The most obvious use is a ditch or channel. Normal ditches are required to have fairly gentle sideslopes, usually flatter than 2 horizontal feet for every vertical foot. For a section of ditch 100 feet long and 1 foot deep, the available volume comes to 7.4 cubic yards.
Another popular example is a pipe in a parking lot. Using the parking lot from the previous example, a system of pipes for stormwater conveyance will be necessary. This will most likely take the form of 15-inch-diameter pipes running along the edge or diagonally across the lot. A square lot will be about 200 by 200 feet, so the pipe system will likely be at least 200 feet in length with two or three inlets and manholes. Manholes are typically 48 inches in diameter. The volume of two manholes and 200 feet of pipe would be about 11.8 cubic yards.
Therefore, using the existing conveyance system for storage has some value. Care must be taken not to make the system too steep or to convey any offsite water through the site, both of which will cast doubt on the practicality of channel storage.
Naturally, this method will work better with substantially larger channels. Taken to an extreme, flood routing programs like HEC-RAS and SWMM become usable, which is not often desirable.
Cheat 10: The Dark Side of Detention
The objective of this cheat is to demonstrate that providing detention will actually be more detrimental to downstream properties than not. This is used most often where no receiving channel is present or where there is a gigantic receiving channel.
A common instance of this cheat is when a site is built on a relatively undeveloped hilltop. It is too high in the watershed to be next to any receiving channels, and it is not practical to cut a manmade channel down the hill or mountain to the stream at the bottom. The alternative is an attempt to release water from the site in undamaging ways. Releasing at as many different points as possible keeps the volumes and velocities of discharges low. However, sheet flow is the real goal. If this cannot be achieved off paved areas or rooftops, making use of level spreaders is the next best thing. However, level spreaders are tricky. They are easy to specify on a plan, but do not set yourself up as the check on construction.
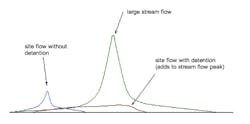
Another great instance of this cheat is where the site is next to a large stream, preferably with a floodplain. As with cheat 3, the increases in runoff from the site can be shown to be insignificant. But this goes one step further, in demonstrating that a detention facility may even be damaging the situation. Large channels will typically have a large delay before peak flow occurs, relative to the storm itself, and to smaller sites. If a detention facility delays the peak flow from the site so it better coincides with the peak flow in the receiving stream, the result will actually be worse than if the runoff drained quickly away, as shown in Figure 23.
Our example in cheat 3 demonstrated this in a small way, as the undetained hydrograph added up to less than the detained one.
ConclusionWhether you are a designer or regulator, a conscientious observer of the rules, or a clever cheater, I hope you will find some of these observations useful. More than ever, it should be evident that having a result in mind can be a significant bias in any calculation. The savvy engineer is not always facetious when asking, “What do you want the calculation to say?” And the answer depends largely on whose side you represent: the developer’s, the regulator’s, the future owner’s, or the downstream neighbor’s. In any case, it behooves all of us to be more aware of our own manipulations—and our own cheats. As a regulator myself, I like to know when a cheat is being used. Together with all the other factors in the design, it can then be considered in context and a judgment made as to its validity. I find that consistency in application is just as important as accuracy and much easier to verify.

