Maintenance of Stormwater BMPs
Although many resources are available to aid in the design and construction of most structural stormwater best management practices (BMPs), few guides exist pertaining to their operation and maintenance. Historically, it seems as though a “build ’em and walk” approach has been commonplace. However, increasing focus upon mass balances, numeric goal setting, and total maximum daily loads (TMDLs) now requires that much more emphasis be placed upon BMP operation and maintenance for permitting and reporting requirements—for example, for the National Pollutant Discharge Elimination System (NPDES) municipal separate storm sewer system (MS4) permit program, and as a part of stormwater pollution prevention plan (SWPPP) reporting.
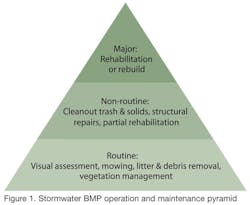
Typically, we think of structural stormwater BMP operation for optimizing (1) the removal of pollutants and (2) the reduction of runoff volumes/rates via the management of stormwater networks or treatment trains. BMP maintenance is the purposeful management of a BMP to maintain a desired level of performance and efficiency. Maintenance consists of short-term (routine or more frequent), long-term (non-routine or less frequent), and major (rare) actions. (Figure 1)
Stormwater BMPs have a lifecycle from their creation (design and construction) through operative stages (functional or not) that is largely dictated by operation and maintenance (O&M) actions. As maintenance involves a significant amount of resources (personnel, equipment, materials, sediment disposal expense, etc.), the more we learn about BMP operation, the more likely we are to maintain optimal performance and improve cost efficiencies. The purpose of this article is to advance short- and long-term maintenance considerations to develop more realistic O&M plans. To do this, we have used a combination of a national literature search for maintenance costs coupled with a detailed municipal public works survey.
Minnesota BMP Maintenance Survey
The statewide survey of Minnesota Municipal Public Works managers to define maintenance needs and guidelines was conducted by the University of Minnesota and partly funded by the Minnesota Pollution Control Agency. Previously, the University of Minnesota produced a manual, Assessment and Maintenance of Stormwater Best Management Practices, which includes source reduction and four levels of assessment (from visual to state-of-the-art monitoring). The manual is available online at www.pca.state.mn.us/water/stormwater-research-and-assessment or http://stormwaterbook.safl.umn.edu.
The specific goals of the survey were to identify and inventory stormwater BMP maintenance in Minnesota. Survey questionnaires focusing on the following questions were sent to 106 cities; we received 27 responses, for a slightly higher than 25% response rate.
- How many BMPs are in your watershed?
- How often are your BMPs inspected?
- What is the average staff-hours spent per routine inspection/maintenance?
- How complex is the maintenance of your BMPs?
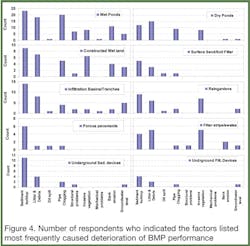
- Which factors most frequently cause the performance deterioration of your BMPs?
- What are the costs for non-routine maintenance activities?
We attempted to make the survey as simple as possible, requesting information for typical response ranges of common BMPs. Although the number of respondents was relatively low, we believe that the results will help refine operation and maintenance needs.
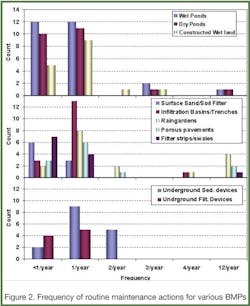
Inspection Frequency and Staff-Hours. The required frequency of stormwater BMP maintenance actions and the associated required staff-hours are two key parameters that are necessary to reasonably budget and schedule inspection and maintenance. Frequency and staff-hours vary according to BMP design, climate conditions, accessibility of the BMP, and maintenance strategies of the BMP operators. As part of the survey, cities were asked to provide information regarding their frequency of routine maintenance actions for various kinds of BMPs.
As shown in Figure 2, the majority (84%) of cities conduct routine maintenance actions once a year or less. Inspection frequency varies significantly due to BMP accessibility and use of proactive or reactive response strategies. “We are working on and around the site every business day, and so inspections happen informally every day,” said Julie Vigness-Pint, BMP grant coordinator at Ramsey-Washington Metro Watershed District, MN. Jim Hafner, the stormwater manager for the city of Blaine, MN, voiced a more typical response strategy. “Our city has not had a proactive program for BMP maintenance. It has generally occurred when problems have popped up,” he said. These differences in maintenance strategies and the execution of maintenance plans have undoubtedly led to a wide variation in the type and frequency of maintenance actions.
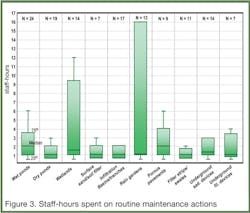
The required maintenance staff-hours depend on the size of the BMP, design configurations, the maintenance strategy, and the complexity of the maintenance action. Figure 3 shows staff-hours spent on routine maintenance actions. Note that the values range from 1 to 4 hours except for wetlands and rain gardens, which typically require more dedicated levels of effort. Staff-hours for wetlands and rain gardens were noted to vary more widely according to the intensity of the maintenance effort.
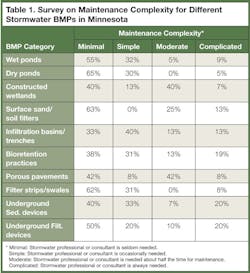
Maintenance Complexity. To assess maintenance complexity, a scale from 1 to 4 was used, with 1 being minimal complexity (i.e., stormwater professional or consultant is seldom needed) and 4 being the most complex (i.e., stormwater professional or consultant is always needed). The complexity of maintenance that BMP operators actually experience depends on the intensity of maintenance efforts; the desired performance level of the BMP; and the maintenance crew’s training, experience, and skills. For most BMP categories, as shown in Table 1, a majority of the responses indicated that maintenance was minimal or simple. For wetlands and porous pavements, however, approximately 50% of the responses indicated that maintenance efforts were moderate or complicated.
Respondents were also prompted from a defined list of possible items on the factors that most frequently caused deterioration in the performance of their BMPs. Litter and debris accumulation and sediment buildup were identified most frequently (Figure 4). Pipe clogging was listed frequently for wet ponds, dry ponds, and wetlands, while invasive vegetation was a specific concern for constructed wetlands and rain gardens. For infiltration basins and trenches, high groundwater levels were identified more frequently than all other issues except for sediment buildup and litter and debris.
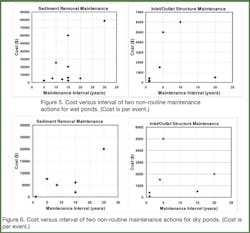
Maintenance Costs. The cost of maintenance actions may vary significantly based on location and the maintenance strategy (proactive versus reactive) implemented. Both the size and design of a stormwater BMP influence the required maintenance frequency and associated costs. However, due to the difficulty in collecting detailed as-built configurations of BMP facilities, size and design were not considered in this survey. Based on survey results, removal of accumulated sediment incurred the largest cost for all BMP categories. For sedimentation practices such as wet ponds, dry ponds, and underground sedimentation devices, inlet and outlet structure maintenance was the second largest cost.
Figures 5 and 6 show the cost of maintenance as a function of the time interval between maintenance actions for sediment removal and inlet/outlet structural maintenance in wet ponds and dry ponds, respectively. The scatter in the data is likely because the data originated from BMPs of varying sizes and designs. Despite the scatter, it appears that any trend line for sediment removal in wet ponds would have a negative intercept, which would mean that there is an overall cost advantage in more frequent dredging of ponds. Ideally, the maintenance interval should be optimized to minimize overall lifecycle maintenance costs without losing the desired BMP performance. To accomplish this, frequent inspection is needed so that potential problems are addressed before the BMP performance deteriorates to unacceptable levels. For example, because sediment buildup occurs frequently (Figure 4) and has a large per-event cost to remove (Figure 5), obtaining accurate estimates of sediment buildup is necessary if budgets and maintenance plans are to be optimally developed. The next section addresses this aspect of sediment management in wet ponds.
Sediment Management in Wet Ponds
We will focus on wet ponds, the most widely used stormwater BMP in Minnesota. As discussed earlier, sediment buildup frequently causes deterioration of BMP performance, and sediment removal has the largest per-event maintenance cost. Therefore, to predict the frequency and cost of sediment removal, it is important to accurately estimate sediment buildup rates.
A wet pond typically operates as a continuous-flow sedimentation tank during a storm event, using settling to remove solids. As with sedimentation tanks, the hydraulic loading (i.e., flow divided by surface area) is an important parameter in determining wet pond pollutant-removal efficiency. Storage capacity is another key component, as declining storage capacity can also reduce the hydraulic residence time and, hence, decrease removal efficiency (Hafner and Panzer 2005) and subject accumulated sediments to washout and downstream transport. Finally, pollutants such as phosphorus can be chemically released from the sediment under anaerobic conditions. Therefore, accumulated sediment should be removed before it significantly degrades the performance of the BMP. One guideline has recommended that sediment be excavated when 25% of the permanent pool volume has been lost (Haubner et al. 2001). By following a predetermined maintenance schedule, sediment depth can be monitored to determine when excavation is required. As an alternative approach, although not as site-specific, sediment buildup can be estimated using the methodology defined in the sidebar.
Overall O&M Cost Estimation
Because actual O&M cost data was insufficient, publications from across the United States that contained cost estimates of typical maintenance schedules for common stormwater BMP categories were evaluated. Cost estimates of lifecycle maintenance expenses were developed for dry ponds, wet ponds, constructed wetlands, bioinfiltration filters (rain gardens), sand filters, and grassed/vegetative swales. All costs were adjusted by means of regional cost adjustment factors (USEPA 1999) to reflect 2005 costs in Minnesota.
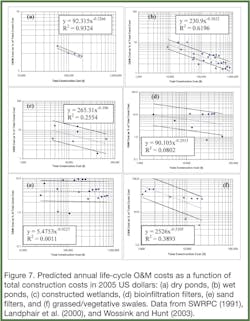
Lifecycle Maintenance. The USEPA (1999) published annual stormwater BMP O&M costs, as a percentage of total construction cost ranging from less than 1% for dry ponds to a maximum of 20% for infiltration trenches. The more recent analyses (Landphair et al. 2000, Wossink and Hunt 2003) have expanded this range. We assembled cost estimates from the literature to create Figures 7a through 7f (Weiss et al. 2005), which are plotted on a log-log scale and contain the equation for the best-fit line. Using known total construction costs, the annual budget for selected stormwater BMP maintenance can be estimated using the equation for the best-fit line (dashed lines) with 67% confidence intervals (solid lines).
Operation and maintenance costs are a substantial portion of lifecycle stormwater BMP costs. Figure 7 indicates that annual predicted O&M costs are on the order of 10% of total construction costs for a stormwater BMP that costs $10,000 (2005 year), and on the order of 5% for a stormwater BMP that costs $100,000 (2005 year). This means that the O&M costs of the stormwater BMP will roughly equal the construction cost (in constant dollars) after 10 years and 20 years, respectively. We can also see that the trend of predicted annual O&M cost, as a percentage of the construction cost, decreases with increasing total construction cost for all BMPs. The trend is slight for sand filters but an economy of scale exists for O&M costs: more expensive (and presumably larger) BMPs require a smaller fraction of the original construction cost for annual operation and maintenance.
Conclusions
Many MS4 communities are struggling to define stormwater BMP operations and maintain needs without available guidelines. As a first step to rectify the lack of guidance, we surveyed Minnesota cities to quantify the frequency of inspection, level of effort needed for routine maintenance, BMP deterioration factors, and maintenance complexity.
Our evaluation of these factors was used to estimate annual maintenance costs of common BMPs for lifecycle operations. Sediment removal and inlet/out structure maintenance were found to incur the largest maintenance costs for most BMPs considered. To continue this effort in Minnesota, an expert council is being formed to establish cooperative efforts related to compilation of maintenance data in standardized formats.
The lifecycle O&M costs are also shown to be a substantial portion of total costs and should be taken seriously. As a general rule of thumb, O&M costs of the stormwater BMP will roughly equal the construction cost (in constant dollars) after 10 years for a $10,000 installation and 20 years for a $100,000 installation (2005 dollars).
Acknowledgements
This study was performed as part of the research project Assessment and Maintenance of Stormwater Best Management Practices, funded by the Minnesota Pollution Control Agency. We thank Lisa Thorvig, Roger Karn, and Don Jakes for their support of this work. We are also grateful to the 27 cities for responding to our survey and providing information related to their experience with stormwater BMPs.
References
Hafner, J. and Panzer, M. 2005. “Stormwater Retention Ponds: Maintenance vs. Efficiency.” Lakeline, 25(1).
Haubner, S., A. Reese, T. Brown, R. Claytor, and T. Debo. 2001. Georgia Stormwater Management Manual, Volume 2: Technical Handbook. First Edition, August 2001.
Landphair, H. C., McFalls, J. A., and Thompson, D. 2000. Design Methods, Selections, and Cost-Effectiveness
of Stormwater Quality Structures. Texas Transportation Institute, Texas A&M University System, College
Station, TX.
Polta, R., Balogh, S., and Craft-Reardon, A. 2006. Characterization of Stormwater Pond Sediments. Final Project
Report. EQA Report 06–572, Metropolitan Council Environmental Services, Environmental Quality Assurance Department Research & Development Section.
Southeastern Wisconsin Regional Planning Commission. 1991. Costs of Urban Nonpoint Source Water Pollution
Control Measures. SWRPC, Waukesha, WI.
US Environmental Protection Agency. 1999. Preliminary Data Summary of Urban Stormwater Best Management
Practices. EPA-821-R-99-012, Washington DC.
Weiss, P. T., J. S. Gulliver, and A. J. Erickson. 2005. The Cost and Effectiveness of Stormwater Management Practices. Minnesota Department of Transportation Report 2005–23.
Wossink, A., and Hunt, B. 2003. The Economics of Structural Stormwater BMPs in North Carolina. Water Resources Research Institute report no. UNC-WRRI-2003-344, University of North Carolina, Raleigh, NC.1. Estimate the average total suspended solids (TSS) input per year to the pond (TSSin):TSSin = 10P * A * C * EMCTSSwhere TSSin = average TSS load entering to the pond per year (kg/year), P = average rainfall depth per year (cm/year), A = watershed area (m2), C = runoff coefficient for the watershed (dimensionless), and EMCTSS = flow-weighted mean concentration of TSS (mg/L) for one year.
2. Estimate sediment accumulated per year in the pond (Sedacc):
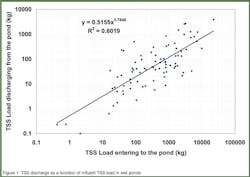
Figure 1 shows the relationship between input and output TSS loads in wet ponds and was created using data from the International Stormwater BMP Database (www.bmpdatabase.org). This figure can be used to estimate the solids captured in the pond as follows:
Sedacc = TSSin – TSSout
where Sedacc = sediment mass accumulated per year (kg/year), TSSin = average TSS mass entering the pond (kg/year), and TSSout = average TSS mass discharging from the pond (kg/year). TSSout can be read from Figure 1 when TSSin is known.
3. Estimate the annual sediment buildup rate (Rsed):
In their field study on wet ponds, Polta et al. (2006) reported the water content (WC) and specific gravity (SGp) of sediment in wet ponds ranging from 0.48 to 0.87 and from 2.04 to 2.72, respectively. This information can be used as input to the following equation to estimate sediment buildup rates.
Rsed = Sedacc / ρw SGp (1-WC) Apond
where Rsed = sediment buildup rate (m/year), ρw = water density (= 1,000 kg/m3), SGp = specific gravity of sediment (dimensionless), WC = water content (dimensionless), and Apond = pond surface area (m2).

