Green Infrastructure and Storm Depth Retention Criteria
The Shift to Storm Depth Criteria
In the September 2009 issue of Stormwater, I (Andy Reese) published an article titled “Volume-Based Hydrology”, that attempted, however poorly, to frame some thinking on the shift in modern stormwater practice from whatever our current state of the art was in urban hydrology to a more volume-focused approach. The drivers for this shift consist of a number of studies and anecdotal stories about how poorly current stormwater flow-through or percent capture requirements and criteria are doing in mitigating the suite of urban development impacts.
This dawning awareness of a need for change is currently being expressed through changes in regulatory criteria throughout the country. These new criteria must boil the myriad of information and opinions into some sort of simplified abstraction of reality. The hope is that the newly developed criteria capture the basic physics with suitable accuracy to do what they are intended to do. In so doing, rule-of-thumb assumptions are proffered, then adopted, and by reason of use become the law and practice of the land.
Those who have been observers of this very human phenomena have seen its application in stormwater many times: “detain such that the post-development 10-year storm equals the predevelopment 10-year storm,” “raise homes to the existing100-year-storm elevation,” “remove 80% of total suspended solids,” and so on. Almost always, there is a set of unintended consequences of such simplifications. Years pass, evidence accumulates, and eventually someone suggests a fix, and the next cycle of criteria development and adoption begins: “detain a range of storms and look downstream;” “manage floodplains for multi-use;” “effluent concentrations and amounts must be matched to stream assimilation capacities.”
The new requirement for volume-based control for federal facilities is a good example of the initiation of this new cycle, and one we will explore in this article.
The recent National Research Council stormwater study (2008) has been pointed to as the match that lit the fire of this shift to volume-based thinking. It states that efforts to reduce stormwater volume will automatically achieve reductions in pollutant loading (and asks us all to substitute the term “Aquatic Resources Conservation Design” for “Low Impact Development”!).
That this may not be a totally true idea has not been debated much (Brown 2010). But we can’t be bothered by that until the next cycle of change in about 10 years.
Wanting to lead the way, this idea got transported to the federal facility side. The 2007 Energy Independence and Security Act (EISA) applies volume-based thinking to redevelopment or new development on federal facilities, stating they must seek to maintain predevelopment hydrology with respect to temperature, flow rate, volume, and flow duration (EISA 2007). This requirement was then clarified by USEPA guidance (USEPA 2009), executive orders, and other flow-down requirements among Department of Defense facilities. At its core is the requirement to retain the 95% storm onsite. (The 95% storm is calculated by taking standard daily rainfall values, removing all records less than one-tenth of an inch, arranging smallest to largest, and finding the value for which 95% of all the values are less.) With federal facilities in the lead, EPA is now considering similar guidance for the Chesapeake Bay.
In parallel, many next-generation National Pollutant Discharge Elimination System (NPDES) Phase II permits are considering or have established infiltration depth criteria (e.g., West Virginia and Tennessee), and some states or local governments have established their own rules (e.g., Wisconsin’s 90% rule, Virginia’s Runoff Reduction method, and Philadelphia’s current capture criterion for impervious areas). Most have some flexibility, allowing options to the stated capture depth or volume.
The remainder of this article looks at an application of the 95% rule to an example site, demonstrates potential problems, and suggests alternatives perhaps already allowed within the rules. With any luck, it will stimulate further thinking about the underlying assumptions while supporting sound convictions that change is needed.
Who knows? Working together, we may even short-circuit the normal cycle a rotation or two!
The 95% Rule
Central to the EPA approach in this arena is a rule of thumb (Option #1) that says the designer should “prevent the offsite discharge of the precipitation from all rainfall events less than or equal to the 95th percentile rainfall event to the maximum extent technically feasible [METF].” (Welcome to the new MEP!) By “prevent” is meant the mandatory use of either infiltration, evapotranspiration, or alternate use of rainwater. Rainfall must go up, go down, or be transformed; it cannot go “off.”
It is also stated (emphasis mine): For the purposes of this guidance, retaining all storms up to and including the 95th percentile storm event is analogous to maintaining or restoring the predevelopment hydrology with respect to the volume, flow rate, duration, and temperature of the runoff for most sites. This 95th percentile approach was identified and recommended, because this storm size represents the volume that appears to best represent the volume that is fully infiltrated in a natural condition and thus should be managed onsite to restore and maintain this predevelopment hydrology for duration, rate, and volume of stormwater flows
(USEPA 2009, p. 12).
Of course, as Murphy’s law would have it, the areas with significant infiltration needs don’t always have soils that easily allow such infiltration. For example, the 95% storm ranges from a mere one inch in Phoenix where sandy soils prevail to 1.8 inches in Georgia red clay. This reality led to some apparent wiggle room. EPA guidance allows for an Option #2:
Another approach to establishing the performance design objective is to…preserve the predevelopment runoff conditions following construction…. Under Option #2, the predevelopment hydrology would be determined based on site-specific conditions and local meteorology by using continuous simulation modeling techniques, published data, studies, or other established tools (USEPA 2009, p. 15).
The guidance goes on to say that data from a “reference site” should be found to help determine predevelopment conditions, and if such data are not available, Option #1 should be used(!).
We should note that Strecker and Poresky (2010) have investigated the real-world practicality of such a rule of thumb in southern California and found a number of problems, including mismatches between rainfall and evapotranspiration data, the predominance of C and D soils, potential hazardous waste sites in urban areas, and the high cost of rainwater reuse.
Let’s stay in the theoretical world for the rest of this article—that is hard enough!
Continuous Simulation Without a Representative Site
Finding the “reference site” is the kicker. It is difficult to find a local and representative site that has good long-term predevelopment hydrologic data. If that is true, then, according to the “letter of the law,” the federal developer must use the 95% rule. That may be the reality some will face.
There are, of course, lots of ways to try to arrive at an estimate of predevelopment conditions short of reference site data. Some can even be accurate.
In our experience, volume-based criteria can only be rightly developed by understanding the long-term flux of water volume; and the only way to accurately do this is through well-constructed continuous simulation modeling that accounts for drying processes between storms. And the need for long-term data may not be as critical as suggested.
Why is this so? Two reasons.
First, there are two kinds of things we try to estimate when it comes to estimating the effects of new development. Some things are absolute: the estimated infiltration rate into the soil, rainfall records, evapotranspiration data sets, the depth to the water table. These things can be (or have been) measured without resorting to years of data. They are either relatively static or applicable across a small region in which my site is located.
On the other hand, some things are relative. If I am trying to climb two flights of stairs for exercise, it doesn’t matter if I climb from the seventh to the ninth floor or from the sixth to the eighth floor. The absolute level is immaterial; the difference is what matters. Most physically based models are far more accurate at predicting differences or changes than they are in estimating absolutes. For example, I may not be able to tell you the absolute value of the 100-year-storm peak flow, but I can tell you with pretty good accuracy the impact of new development on a change in that peak flow.
If our goal is to try to restore the hydrology of a whole neighborhood or watershed to some pre-European-species-invasion value, then an absolute estimate of pre-settlement parameters is important—if not impossible (McCuen and Davis 2010). But if I am trying to mitigate a change in hydrology, then as long as I am as accurate as possible and consistent between modeling of pre- and post-development, I may be accurate enough. The key is trying to make sure the difference in pre- and post-development is accurate even if the actual values cannot be fully calibrated. Close counts.
The second reason is that “data” can be a misleading term. It is a promise with conditions. Accurate and “typical” volume-based data are hard to come by and filled with uncertainties. Are the few storms I measured really indicative of the watershed response? Did I estimate the antecedent moisture correctly? Are there any important variables not tested by these data? Did I account for land use changes adequately? Would the addition of impervious data skew the results so as to make them inapplicable? The phrase “data show…” has covered many a blunder.
Continuous Simulation Model: Overview
Let’s presume for the rest of this article that a well-conceived continuous simulation model may be acceptable as an analysis tool even without a reference site, see what it can do, and use it to take a hard look at the 95% rule.
We might ask the following questions: Is capturing the 95% storm equivalent to “mimicking nature”? Are there other options that might provide more flexibility? How easy are these options to place into a design framework acceptable to developers, reviewers, and regulators? These are the questions we decided to explore for the Nashville area as part of a comprehensive green infrastructure master plan.
The modeling was essentially of two kinds:
Site Response Modeling. For the predevelopment condition, we developed hourly rainfall-runoff models for the years 1970–2006 for a set of parameters representing the four typical NRCS soil types: Hydrologic Soils Groups (HSG) A, B, C, and D for a typically vegetated site.
We then created post-development models by placing 40% impervious area (typical of moderately dense residential development) on each site with either directly connected impervious area (DCIA) or sheet flow runoff to the remaining pervious area. To look at the other extreme, we created models with 100% impervious area.
We used a 12-hour inter-event dry period (IEDP) to distinguish storms for analysis purposes, which resulted in 2,317 storms over 0.1 inch in depth.
Volume-Based Design Criteria Modeling. We also modeled a 100% impervious area draining to bioinfiltration facilities (among other green infrastructure types) across a range of parent material infiltration rates, media depths, and ratios of impervious to facility surface area. (We also modeled cisterns, rain barrels, urban forests, tree planter boxes, porous surfaces, and green roofs to establish volume-based design criteria.) The models covered the complete range of these three design variables. The purpose was to develop an ability to use the power of continuous simulation to establish design standards that can be used in most normal applications without the need for every developer to create custom continuous simulation models.
Though not discussed here, to test climate sensitivity, we also did a quick comparison to Phoenix, AZ, data (1950–2006), changing only the climatic variables to be able to compare apples and apples. This resulted in 1,008 storms over 0.1 inch in depth. (Think of it as that one in a hundred lots that insists on having a lawn like they had in New England.)
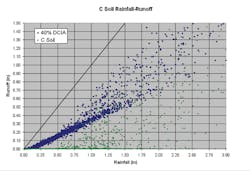
Figure 1 demonstrates rainfall and runoff values for C soils and C soils with 40% DCIA. The line represents a pure runoff response.
An Assessment of the 95% Rule
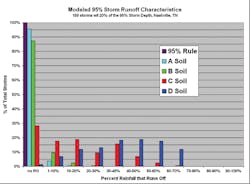
Predevelopment Conditions. Our initial step in an assessment of the 95% rule as it applies to Nashville was to look at all storms that were close to the 95% storm depth (1.74 inches) for Nashville and see how the predevelopment condition for the four soil types actually handled them. Figure 2 shows the results of modeling 159 storms that were all within 20% of the 95% storm depth for Nashville. There was little variation in the outcomes from the largest values to the smallest within the sample.
We decided to present the findings as visually as possible. The horizontal axis represents a range of “buckets” of runoff percentages compared to the rainfall percentage. The vertical axis represents the percentage of storms that had that runoff characteristic. For example, if you look at the 40–50% bucket on the horizontal axis, you will see that for D soils (dark blue bars), 18% of all storms produced runoff that was between 40% and 50% of the rainfall. Six percent of C soils produced such runoff, and no A or B soils produced any runoff in that range. Thus each soil has its own “signature” distribution.
Also shown in Figure 2 by the purple bar is the soil signature assumed by the 95% rule: that is, there is no runoff from these storms.
What one could surmise from this chart is that the 95% rule seems to approximate reality for A and B soils fairly well where more than 95% and 85%, respectively, of all storms are fully contained. This criterion does a less accurate job for C and D soils, which shift markedly to the right (more runoff in the “real” modeled world). If we imposed such a rule on sites underlain by these types of soils, we would, in effect, be requiring a greater amount of infiltration than occurs in nature, perhaps with unpredictable implications.
We also looked at the one-inch criterion proposed in Tennessee and adopted in West Virginia. A similar chart was prepared for 381 storms within 25% of a one-inch storm. That analysis demonstrated an 82% containment rate for C soils within that storm range and a more than 100% containment for A and B soils. Detailed analysis shows that a one-inch criterion may under-retain for A and B soils even when it best matches C soils. Further details are outside the consideration for this article.
Post-Development Conditions. What are the implications of the 95% rule for post-development mitigation?
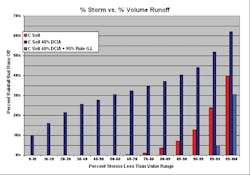
A model was created with 40% DCIA. Then, by way of volume increase mitigation, the 95% rule was applied to the site in the form of determination of the volume of rainfall that green infrastructure would need to retain to meet the 95% rule. Figure 3 shows the result. This analysis is for C soils only.
The axes in Figure 3 have been changed from those in Figure 2, because this analysis covers all storm depths, not just those near the 95% level. The horizontal axis represents ranges of percent storm in 10% increments until the 80th percentile storm. Then the increments decrease to allow better visualization of the higher percentage storms that account for the bulk of the runoff. The vertical axis is the percent of rainfall volume that runs off.
The red bars show the predevelopment condition. The dark blue bars show the runoff distribution for the 40% DCIA post-development condition.
For example, for storms greater than 85–90% of all storms, 7% of the total rainfall runs off in the predevelopment condition, and just over 40% of the total rainfall runs off in the post-development condition, in which the site has 40% directly connected impervious area.
Analysis shows that a green infrastructure volume capacity of 1.2 inches would be necessary to retain all of the storms in the 95% range (i.e., no runoff below 95%) (minus the small amount of rain that infiltrates during the storm peak flow storage demand period not modeled). The resulting runoff response is shown by the light blue bars in Figure 3. It is visually obvious that this standard does not well mimic the response of the natural predevelopment site (red bars) to the range of storm inputs.
Modeling shows that C soils for the predevelopment condition captured 87% of all rainfall on an annual basis through infiltration and evapotranspiration. The 40% DCIA situation created only a 58% capture rate. Application of the 95% rule resulted in a capture rate of 94.4%, or 7.4% above natural conditions. This may or may not be significant, but the cost of construction of green infrastructure to attain this standard is significant.
These results caused us to look for an alternative criterion that may provide a better match of predevelopment conditions at lower overall cost.
An Assessment of an Alternative Criterion
Overview. There are many goals or objectives for volume-based hydrology, and the reader is referred to the 2009 article mentioned above for a more full-bodied discussion. In that article, we concluded that some combination of volume retention (green infrastructure), flow-through treatment (if pollution goals cannot be attained with green infrastructure alone), and volume storage in time (aka extended or regular detention) for the larger storms was probably best. The objective was to match nature at every rainfall-runoff level, recognizing that even nature sometimes simply delays runoff for the larger storms with much of what we think of as infiltration returning quickly to the streams via interflow. This is especially true in Nashville, where bedrock and solution channels predominate.
For the infiltration portion, we asked the question: “What does hydrologic mimicry really mean?” The new federal requirement states that capture of the 95% storm is the key parameter for our hydrologic reality. Depending on the desires of the local government, other parameters may be more appropriate.
Recall that capture of the last few percent under the 95% rule greatly increases the necessary volume because of the need to have “standby volume capacity” for a few larger storms. This may be part of the reason why other approaches in the examples given previously have found ways to provide a flexible alternative. Options included the ability to treat runoff that could not be effectively retained (Virginia), consideration of runoff from only the impervious areas (Philadelphia), or stating a number less than 100% of predevelopment infiltration (Wisconsin, West Virginia).
We decided to look at it using the inherent power of continuous simulation. From a total water balance standpoint mimicking the total annual infiltration may be a sound goal, and one that is easily estimated and attainable through continuous simulation modeling. We assessed annual infiltration as the parameter of choice. For our purposes we did not try to partition losses to mimic percent evapotranspiration and infiltration–though all the data are available.
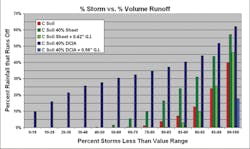
The goal of the exercise was changed from capturing the 95% storm to mimicking the total annual infiltration for a predeveloped site and seeking to match percent runoff as much as possible across all ranges of storm depth, and placing the results into a design framework. Figure 4 shows the result.
Basic Analysis. The red and dark blue bars are the same as in Figure 3—predevelopment and 40% DCIA, respectively. In the case of mimicking the complete range of storms, the accumulated losses from the sheet flow of the many smaller storms across grassy areas becomes important. Therefore, we also modeled a 40% impervious area with the impervious area sheet flowing across the remaining grassy area.
The impacts of this simple design change are striking. For example, for the 70% to 80% storm range, only about 2% (red bar) of the rainfall runs off in the undeveloped condition. For the 40% DCIA condition, this increases to 35% (dark blue bar). If we merely design sheet flow across the grassy C soil the runoff volume shrinks from 35% to 10% (dark green bar).
The total annual capture volume for the predevelopment condition is 87%. For the 40% DCIA case, it is reduced to 58%. For the sheet flow case, it increases to 74%, a 16% increase due to the Better Site Design feature.
Green Infrastructure Additions. To make up the difference, site runoff was routed to a bioinfiltration facility. A spreadsheet capture tool was developed allowing for fast “what-if” analysis.
For the 40% DCIA case, a green infrastructure capture depth of 0.56 inch from the whole site, or 29% of the total rainfall volume, produced runoff that approximated the predevelopment annual capture condition. This result is shown by the light blue bars in Figure 4. Note that this green infrastructure capture volume shifts the runoff distribution in a way that better mimics the predevelopment condition (i.e., a shift from dark blue bars to light blue bars through the addition of green infrastructure).
For the sheet flow (Better Site Design) case, modeling showed that the grassy areas would reduce the required green infrastructure capture volume to 0.42 inch–a 25% reduction for little or no construction cost (light green bars).
Note that the 95% rule criterion resulted in a necessary capture depth of 1.20 inches, which amounts to more than a 200% increase in required green infrastructure capture volume, simply by changing the definition of hydrologic mimicry.
The decision of which approach is more appropriate in a specific case is not dealt with here, but commentary on the Stormwater website is welcomed.
Truth in Lending. Before we think to adopt a different capture goal altogether, it should be noted that analysis of other soil types gives different conclusions. For example, analysis of HSG A soils shows that development increases the runoff much more significantly than for C soils, making mimicry of predevelopment conditions all the more difficult.
The model predicts that, under predevelopment conditions, 99% of all rainfall is captured. Through simply sheet-flowing the runoff through Better Site Design, 96% is captured. However, capturing the other 3% requires 0.67 inch of green infrastructure volume. The requirements are much worse with directly connected impervious areas. The capture is only 66% without sheet flow or green infrastructure, and the green infrastructure capture volume to attain a 99% capture rate is 1.45 inches.
And there is a switch in which criteria require less green infrastructure capture volume. Meeting the 95% rule for the 40% DCIA case is relatively easy, requiring 0.48 inch of green infrastructure capture volume.
Volume-Based Design Criteria
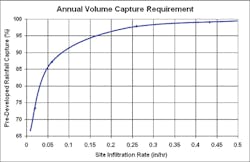
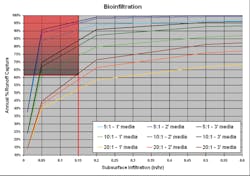
Modeling the complex interplay of runoff factors and analyzing the results over the range of storms encountered over many years is great work for graduate students, but would be a difficult burden for day-to-day site stormwater design. For this reason, we created Figures 5 and 6. Figure 5 shows the annual capture rates for predevelopment conditions with points at the four soul types. It is the capture goal. Figure 6 depicts the effects of design variables on bioretention performance in Nashville. It is effectively a design contour map showing different combinations of infiltration rate, media depth, and impervious to bioinfiltration facility area ratios. Other figures have been developed for other green infrastructure approaches.
These graphs can be used as follows for a typical site:
Our site is 40% impervious and we have chosen to sheet-flow the runoff across grassy areas meeting local slope, planting, and length requirements.
Step 1. Site infiltration testing shows a reliable rate of 0.15 inch per hour. Figure 5 shows our required capture percentage: 94.5%. Basic continuous modeling or other locally developed graphs (not shown here) show the predeveloped site naturally handling 70% of annual rainfall through evaporation, transpiration, or infiltration. Green infrastructure must handle the other 24.5% for the whole site. We are using green infrastructure to capture flow only from the 40% impervious area, which equates to 61.25% capture (24.5/0.4).
Step 2. Use Figure 6 design graph to choose a facility to mimic predeveloped water balance. A proper design could incorporate any facility plotted above 61.25% runoff capture and to the left of 0.15 inch per hour (red shaded area). Thus the designer would have a choice of a 20:1 impervious to bioinfiltration surface area ratio with a 3-foot media depth at one end, or a 5:1 impervious to bioinfiltration surface area ratio with a 1-foot media depth at the other.
Conclusions
The purpose of this article is to explore the proposed single-criterion 95% storm capture requirement as a suitable volume-based hydrology criterion and to explore and propose different options.
To do so, a continuous simulation analysis of hourly rainfall and runoff was performed across four soil types for both pre- and post-development conditions. HSG C soil results are featured to demonstrate the issues.
Volume-based criteria are very sensitive to the ability of the parent soils to infiltrate water and the configuration of the impervious surfaces with respect to sheet flow (runon) across grassy areas. Any criterion that does not recognize that sensitivity will eventually cause problems. A single-depth criterion not attuned to local situations is probably an awkward fit and should be used only when other opportunities are unavailable.
Realistic alternatives to a single-value criterion that do not require the difficult and time-consuming collection of years of data should be framed. One alternative has been developed here–matching annual runoff (and by default, annual capture).
Continuous simulation models may be an effective answer to volume-based criteria and design generation because the driving data are long-term rainfall and evapotranspiration patterns. Some of the inherent power in continuous simulation can be harnessed through the development of generic design curves based on the data output.
There is a need for a simple, hardwired, and intuitive software tool for the design of volume-based sites that contains sufficient flexibility to model differing soils and groundwater configurations, has local data hardwired into it, and has an effective pre- and post-processor (or takes advantage of existing software and export capabilities) for visual input and output.
References
Brown, T. 2010. “Can Volume-Based Stormwater Criteria Make a Difference to Receiving Stream Health?” Water Resources Impact, Vol. 12, No. 2, March 2010.
Energy Independence and Security Act of 2007, Section 438.
McCuen, R. H., and A. P. Davis. 2010. “Sensitivity of BMP System Designs to the Sustainability Objectives Defined by Predevelopment Conditions.” Water Resources Impact, Vol. 12, No. 2, March 2010.
National Research Council. 2008. Urban Stormwater Management in the United States.
Strecker, E., and A. Poresky. 2010. “The Feasibility and Desirability of Stormwater Retention on Site in California and on the West Coast.” Water Resources Impact, Vol. 12, No. 2, March 2010.
USEPA. 2009. Technical Guidance on Implementing the Stormwater Runoff Requirements for Federal Projects under Section 438 of the Energy Independence and Security Act. EPA 841-B-09-001, December 2009.
Phase II Permits
The following links provide more information on the state and local permits mentioned in the article.
Philadelphia, PA:
http://www.phillyriverinfo.org/Programs/SubprogramMain.aspx?Id=Regulations
Tennessee:
http://www.tennessee.gov/environment/wpc/stormh2o/MS4II.shtml
Virginia:
http://www.dcr.virginia.gov/documents/stmrunredmethmemo.pdf
West Virginia:
http://www.dep.wv.gov/WWE/permit/individual/Pages/default.aspx
Wisconsin:
http://dnr.wisconsin.gov/runoff/pdf/rules/NR151SubchapterIIIFactSheet.pdf

