Green Infrastructure Sizing Criteria Development
“Everything should be made as simple as possible but not simpler.” –Albert Einstein
A History of “Simpler Than Possible”
It was the early 1950s and Johnny, who came marching home, wanted a two-bedroom ranch in a tidy neighborhood. From a stormwater (OK, “drainage”) perspective, “tidy” meant efficient drainage with curbed streets. The Rational Method was king. Calculate the 10-year peak flow. Size a pipe to get it to a creek or ditch. Done. Simple.
In the 1970s, smart people and flooded people began to understand that efficient drainage came with some unforeseen drawbacks–mostly flooding and erosion. It was a simple yet flawed concept–simpler than possible, it made sense until you looked more deeply, or, failing in that, experienced more fully. So, detention ponds became the right way to do things–and to avoid being too complex most were designed only for the 10-year storm; post equals pre. Calculate a 10-year hydrograph. Route it. That ought to do it. Simple.
Of course, that did not do it–and in another 10 to 15 years we realized that that design criterion should have had a bit more scientific examination before becoming standard engineering practice. At a fairly perfunctory level, it seemed to make sense. The 10-year storm was the intermediate collector system peak-flow design storm, so why not simply detain that? What could be simpler? Well, maybe nothing. It did do some good, but some good was not enough good. In the end, it did not work out all that well . . . simpler than possible.
Not to belabor the point, but perhaps the most recent example of stormwater violation of Einstein’s pithy axiom would be the 80% total suspended solids (TSS) removal requirement. The general idea is sound, but the devil is in the details, and nature never misses a detail. About 80% seemed right and attainable. But in real-world situations of highly variable input concentrations, the shortcomings in both concept and design became obvious; 80% removal of TSS in distilled water is zero, and 80% of TSS removal in mudflow can be attained by my bathtub. Assuming TSS is the right focus to begin with.
We are now in the midst of another stormwater design paradigm change. Without debating the merits of the volume-based design approach and the use of green infrastructure (GI), it is safe to say that various states, regions, and cities are in the throes of trying to figure out what to tell developers and redevelopers to do for proper GI sizing. And because, at this writing, EPA is updating its stormwater strategy to focus on pursuing a suite of immediate actions to help support communities in addressing their stormwater challenges and deferring action on rulemaking and establishment of a national standard, everyone is doing what is right in their own eyes. (Yes that is an oblique reference to the biblical Book of Judges 17:6, where the same problem was happening.)
Several approaches are emerging across the country as leading contenders. Are these approaches sound and effective, or are there some issues with them that might make them our own personal “simpler than possible” episode? My intent here is to stir up more critical thinking on behalf of states and others, who, in light of the vacuum of national guidance, will develop their own.
In the September 2013 issue of Stormwater, I (Andy Reese) published a guest editorial called “Not Simpler than Possible.” At the risk of nagging, we want to expand on some of the thoughts in that editorial here. In part 1 (this article), we lay out a handful of foundational problems with the logic that serves as the basis for these approaches. In part 2, we will look at some ways we can avoid being simpler than possible, hopefully without getting more complex than helpful.
Green Infrastructure Sizing Criteria: Five Foundational Concerns
There seems to be two major categories of contenders for a volume-based design criterion: depth of capture (say, 1 inch of rainfall or runoff) and for others (including all federal facilities) a “percent storm” capture (say, the 95% storm). Of course, there are many variations on the theme, such as the “treatment volume” or the “design storm” approach, but they are essentially the same thing with some afterthought to attempt to address the basic logic problems incurred. Emerging in the West is the flow duration approach or its sediment-transport smarter cousin, reflected in the East as the channel protection volume, but this is mostly applicable in situations where the issue is channel degradation not simple volume control–so we will skip that here. Though in any situation where channel erosion is important, some control of channel forming discharges is warranted. And we cannot forget about pollution removal from runoff even if we are stabilizing channels.
The basic volume-based design criterion stated succinctly is:
For my local stormwater program, the right daily rainfall volume (percent storm or rainfall depth) must be captured and retained onsite through the use of green infrastructure.
Let’s break that down into five intertwined components of our current national design dialog:
- The objectives of my local program
- Daily rainfall analysis
- Instantaneous volume capture
- Percent storm capture (say 95%)
- Depth of capture (say 1 inch)
Now the fun begins.
1. Local Program Objectives
There are many reasons to initiate a GI program. Some of them are mandated. The mandated ones are combined sewer overflow (CSO) reduction and municipal separate storm sewer system (MS4) (and related programs such as total maximum daily load, or TMDL) compliance. Beyond the mandates, there are some physically based real-world reasons to use GI, including stream baseflow maintenance, ecological preservation, stream stabilization, water supply protection, and flood reduction. Other reasons to use GI might include aesthetics, property value preservation, retail sales improvement, keeping the Millennial generation happier, or mayoral prestige preservation. It might be that the triple bottom line value of GI to mankind creates a very attractive holistic return on investment (ROI) that causes a city to move aggressively in that direction–and (not) incidentally might delay for decades a huge gray infrastructure investment. (Even if a more hardnosed and independent business evaluation might not return such an attractive ROI outside imposed stormwater fees and local design requirements.)
Let’s stick with the two mandated reasons: CSO reduction and an attempt at either hydrologic mimicry or attainment of “acceptable” hydrology under the auspices of MS4 and related programs.
All individual GI approaches can be thought of as a combination of a bucket and a hose. The bucket reflects provisional storage space for instantaneous rainfall capture volume. The hose represents the ability of the GI to remove rainwater volume from the bucket to some destination with less impact than pavement during and between rainfall events. Hose destinations might include infiltration as interflow or deeper groundwater, underground injection, evapotranspiration, delayed piped discharge, graywater reuse, irrigation, or something else (e.g., drinking water as allowed in Atlanta). For example:
- A cistern is all bucket. The hose has a spigot on it and, unless automated, depends on someone turning it on.
- A tree is almost all hose. It can capture very little instantaneous rainfall in its leaves, so to maximize its effectiveness we have to pair it with a bucket–get moisture to the roots and hold it there without drowning the tree.
- A rain garden (aka bioretention) is a balanced combination of bucket and hose. It is highly popular and can be effective for water-quality treatment. For flood control, it can tend to look and work like a leaky undersized detention pond.
- An injection well into deep gravel or sand can be a magnificent hose. Places in Florida, the Rockies, and the Pacific Northwest routinely use this approach for flood control. However, such an approach provides little pollution removal without top-end filtration.
- Plain old open space can be an amazing combination of bucket and hose if it is amended to improve infiltration and contact time is enhanced with designed sheet flow, terracing, or berms.
- Gravel or underground vaults can be buckets and, when the hose is properly sized to match infiltration demand intensity, can work even at very low native soil infiltration rates.
- A green roof is a fairly pricey bucket by some measures, and the hose depends on evapotranspiration alone unless extended detention outlets are added. But if that works for our driver then we might just get rid of the pesky volume-taking green part and simply call it a blue roof (aka rooftop detention).
There is huge variation in this list. But every one of these options has been called green infrastructure by somebody. And with GI there is always some condition or some disclaimer on wholesale approval. Nothing works everywhere for everything.
So what about our program objectives combined with our local situation?
If mandate one, CSO reduction, is the name of the game then near instantaneous volume capture with eventual volume removal or runoff delay is the key focus. Evapotranspiration, for example, is of little value during an overflow event even if it can be helpful between events in restoring volume capacity of a bucket. It is all about peak-flow reduction. Can GI do that? Yes and no.
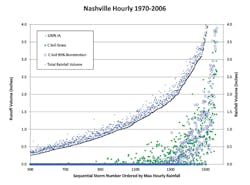
Figure 1 shows the ability of a GI bioretention pond to counteract flooding for a low permeability C soil. It is for hourly Nashville data divided into storms with a 72-hour inter-event dry period (IEDP) to reduce prestorm wetting and runoff from a predevelopment parcel (green dots), a 100% impervious parking area (black), and the developed site routed through bioretention sized for instantaneous full-porosity capture of the 95% (1.76-inch) storm (red dots). The right-hand axis is the maximum hourly rainfall rate and shares the black dots with the 100% impervious area (IA) line.
Although there are many things that can be gleaned from this figure, one thing is that the bioretention reduces many of the storms significantly, some even below the predevelopment grass condition. On average it reduces all storms with a maximum hourly rainfall rate of half an inch per hour and greater by 65%. However, flood control is not about averages–it is about safety and zero tolerance. It can be seen that there are many storms whose runoff (red dots) is nearly equal to the impervious value. The reason is that the bioretention pond is reaching capacity prior to the most intense rainfall. If I am trying to reduce overflows that occur several times a year, then this sort of approach can help do that. But if I am trying to eliminate flooding of property downstream or eliminate all overflows, then it cannot do that much. It is really just undersized detention.
If, on the other hand, I have deep gravel or sand, then my bioretention can be designed to look like a throated injection doorway into a near-infinite permanent holding area. Or, if my locale sits atop shallow bedrock, then a bioretention system with an elevated underdrain system can mimic the natural recession curve of a predevelopment watershed. In both these cases GI can solve the problem.
The added fact that most GI is “dumb” when it comes to catching volume makes it rather inefficient in some cases unless it has high infiltration rates. By “dumb” I mean that it is nonselective in which volume it catches. The first volume that comes along is trapped in the GI. Normally that volume would have been treated by the plant and not be part of an overflow. Thus ratios of capture volume to overflow abatement volume can be well over 6:1 or even 12:1. Real-time controls now in development solve that problem.
If mandate two, MS4 and related compliance, is in play, then mimicking some sort of predevelopment or acceptable hydrology is the GI program objective. In that case the whole hydrologic cycle, the time between storms, and every kind of land use are important. The challenge here is that we are taking a porous landscape and attempting to focus that 100% porosity into a handful of small pinpoint sites scattered around the impervious surfaces. Thus “hydrologic mimicry” generally becomes more difficult and expensive to attain the more intensely developed the site is.
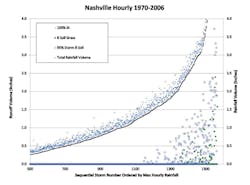
Figure 2 shows the same site as Figure 1 but compares volume removal instead of peak flow control. Blue dots are total rainfall, black are total runoff for the 100% IA case. Green dots are the predevelopment grassy condition, and blue circles are the volume of runoff points for bioretention sized for the 95% storm. As can be seen, the same bioretention system can actually mimic the annual runoff amount very well even though the ultimate distribution of rainfall among deep infiltration, shallow interflow, evapotranspiration, and runoff will shift. This site can approximately mimic the volume aspect of predevelopment hydrology across the spectrum of real-world rainfall events. Recall that this is for a very-low-infiltration-rate site. For a site with a higher infiltration rate, a smaller structure could be used and would infiltrate more–which in one world is good, another bad.
These two mandates bring about radically different approaches to the use of GI, and what GI may mean altogether. The first is all about instant, storm-based volume capture. The second is about an ability to mimic nature over longer periods of time–perhaps annually.
Let’s grant that CSO reduction requires either a big bucket or a big hose, or a moderately sized both. But for the rest of the world, mimicking nature to some extent should be our goal. So let’s explore how this goal has lead to some unintended consequences in GI design.
2. Daily Rainfall Analysis
GI design has taken a turn toward the design-storm approach. Percent storm capture or even required depth capture statistics are tied to a “percent storm.” What is a percent storm?
USEPA guidance for federal facilities has been used for all locations around the United States (USEPA 2009). It works like this:
- Obtain daily rainfall amounts from NOAA.
- Line them up smallest to largest.
- Delete all amounts that are 0.1 inch or less.
- Assign a percent less than number to the remaining daily values.
- The daily rainfall value that equals 95% less than is the “95% storm.”
Seems simple enough, and the data are readily available. It leads to quick design criteria. But does it make sense? It is easy to lose our way when we think about daily rainfall, so let’s use an analogy to think about this. Assume I am a window washer trying to determine the 95% tallest office building in New York City for my purchase of ropes and other equipment (instead of the “tallest rainfall”).
Five percent of all buildings will be taller in my analysis. I go about it like this. First, I arbitrarily disqualify all office buildings that are three stories or less because maybe I don’t want to wash something that small. Then, because the data are given in terms of “floors constructed per year,” I say that we can count only the floors constructed in any one calendar year. The floors up to December 31 count as one building, and those built on top of them January 1 and later count as a second building. The first constraint radically reduces the number of buildings under consideration, while the second not quite so radically increases the number of buildings, but they are all smaller than the actual building height. The first assumption may make some sense if I am interested only in washing windows, not the actual real-world data. The second is strictly a matter of convenience. It would take some work to merge the data to get actual buildings.
That is essentially what daily rainfall analysis does. What is the potential impact on real-world decisions?
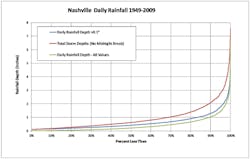
If I am trying to determine what happens to all the rain that falls, then why do I eliminate a significant percent of it? The reason, of course, is that storms 0.1 inch and under may have no runoff. But in my design I already account for that in my runoff coefficient. So I am effectively double-counting that 0.1-inch loss. It is only about 4% by annual volume, but it decreases the number of storms by 56%. Figure 3 shows the EPA daily rainfall analysis for Nashville. The blue line is the standard analysis. The green line shows the distribution if I do not arbitrarily remove all rainfall events 0.1 inch or less. The 1-inch storm moves from the 84% storm to the 90% storm.
If I am concerned about water remaining in my structure when the next storm comes, or the size of a storm that may cause overflow, why do I cut 15% of the storms in two pieces? The red line in Figure 3 shows the curve if I do not allow for an arbitrary break at midnight but join the storms in a more natural way–in this case, if adjacent days have rain they are considered to be one storm. The 1-inch storm moves from the 84% storm to the 70% storm.
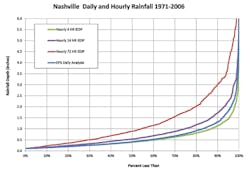
Figure 4 shows the standard EPA guidance analysis compared to an actual storm analysis using hourly rainfall values and different IEDPs. It can be seen that for Nashville the standard analysis is equivalent to counting actual storms with a six-hour IEDP. In Nashville the soils are mostly HSG C and infiltrate slowly. Assuming independent storms but with an IEDP of only six hours would undersize systems, because in many cases the practice would still be partially filled with water after six hours.
It is clear that the design storm and daily rainfall analysis approach may have some problems. If what is important is the way a total site treats the total rainfall record over time, then perhaps the design-storm approach is fundamentally wrong. We use it because continuous simulation is difficult.
Or is it? In Part 2, we’ll look at that question. But for now….
3. Ninety-Five Percent Storm Capture
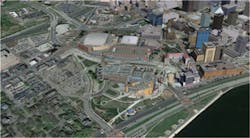
The 95% storm is different in every city. It depends on climate factors. In the spirit of Einstein, let’s do a thought experiment. Figure 5 shows the River Center, a great convention site in St. Paul, MN. That site has a certain amount of impervious area and sits atop a certain combination of soils and bedrock. It has a specific topography. The 95% storm in St. Paul using standard EPA daily rainfall analysis (any percent will do) is 1.33 inches.
Now for many years we in Nashville were jealous of this convention center until we built the great guitar in downtown Nashville last year. If, by some strange chance, we were able to move that total site (buildings, soils, geology, vegetation, topography–everything) to Nashville, it would behave exactly as it did in St. Paul in response to rainfall. The physics of rainfall and runoff are the same in our part of the earth as they are in St. Paul. The site is the same in every detail down to, let’s say, 1,000 feet into the ground. The rainfall and runoff signature of that site does not change one raindrop. Nature would handle it exactly the same.
Yet under this standard the amount of rainfall we would need to capture with this exact same site is now 1.76 inches of instantaneous rainfall; 1.76 is 32% larger than 1.33 even though every possible thing about the site is the same.
It gets worse. If I chose Memphis instead of Nashville, I would have to capture 2.03 inches; Knoxville and I would have to capture 1.45 inches; and Johnson City in the far northeast corner, 1.25 inches. If I give up on this foolishness and move my convention center to Phoenix, I would have to capture only 0.97 inch. Talk about your vacation destination!
By adopting this standard I am effectively implying that soils and slopes and water behave differently depending on where on Earth they are. Not so. The site removes the exact same amount of water for the exact same storm no matter where it is. The amount of water it can handle remains constant, not the percent storm. Capturing the 95% storm may be way underestimating what hydrologic mimicry looks like in Phoenix, and way overestimating what hydrologic mimicry looks like in Nashville.
So, is the right answer to simply require the same capture depth, then?
No. If we do, we run head-on into another problem.
4. One-Inch Capture Depth
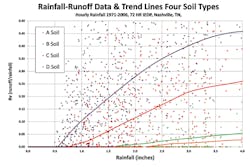
Let’s assume I am going to build a big box store in Nashville. I have a choice of four sites identical in every way except the underlying soils. One site lies over A soils, another B, another C, and another D. As shown in Figure 6 for Nashville, on average, capturing 1 inch in A soil is easy. In D soil it is nearly impossible to do so naturally.
What is hydrologic mimicry, then? Is a one-depth-fits-all mimicry? Not at all. But it is simple.
One problem with having a standard depth in one locale is that it is unfair to those parcels located on D soil and way too easy for those located on A soil. Hydrologic mimicry varies by parent soil characteristic and underground stratigraphy. To the extent stormwater requirements have any influence on building location, having a single capture depth will tend to drive construction to sites that have the most advantageous soil: A soils, soils that may be our recharge zones. This simplistic one-size-fits-all standard might tend to bring about the exact opposite thing desired by concerned environmentalists.
I realize that there is a complication in that many soils in an urban setting have been modified beyond recognition. So we cannot simply use the soils mapping. This is true, but it has always been true. A better approach would be to specify an assumed low infiltration rate–say C soil lower end of the infiltration spectrum–and allow developers to prove that is not the case on their sites. In many cases the surface compaction has not impacted the lower soil horizons, the very depth at which infiltration systems discharge their runoff. In other cases amending soils to increase absorption can be an inexpensive and natural way to enhance infiltration with little subsequent maintenance (if compacting activities can be channeled somewhere else).
The problem can get a bit more insidious. Figure 7 shows the same thing as Figure 2, volume control for a site that is 100% impervious. However, in this case the site is constructed on HSG B soils, not HSG C. While on an absolute basis the structure in B soil removes 60% more runoff than the same structure in C soil, from a relative hydrologic mimicry standpoint it underperforms the C soil structure. If my goal is to capture a certain depth (in this case 1.76 inches) no matter the location of the site, then the B soil bioretention does it more easily. But if my goal is to attempt to mimic predevelopment hydrology or at least to provide an “acceptable” level of hydrologic response, we are moving in exactly the wrong direction.
5. Instantaneous Volume Capture
Let’s take a step back from specifics and look finally at an underlying assumption that lies at the heart of what may be wrong with this approach.
Nature is horrible at the capture of large amounts of rainfall volume instantaneously. To do it requires a depression such as a sinkhole, lake, or pond. Gray infrastructure mimics this instantaneous capture ability more cheaply than GI. Figure 6 depicts the ability of HSG A, B, C, and D soils to capture various depths of rainfall. It is based on hourly continuous simulation of 35 years of data in Nashville, TN.
You will notice that, except for the very smallest storms on the most porous soil, almost every other total storm depth has some bursts of rainfall that are so intense that there is runoff. From the trendline, it can be seen that C soil, on average, will handle the 1-inch storm. But there will be many storms under an inch that generate runoff.
Here is the problem then. If I stipulate a design criterion that reads like “capture the first…” then, to meet that criterion most easily, I need to depart from mimicking nature and take a giant step toward gray infrastructure systems–even if they are painted green. No matter what, I must capture the first inch (say). So, even though grass and trees can mimic nature very well, the system I design, no matter what, must have a volume in place to “capture the first….” I need a tank.
Every GI design standard that states or implies instantaneous volume capture departs from the spirit and intent of GI programs and heads toward an over-engineered deterministic system. The GI control volume size to capture an inch every time is 1 inch. The size to capture an inch on average is maybe half-an inch. I have inadvertently created a program focused on overdesigned structural controls.
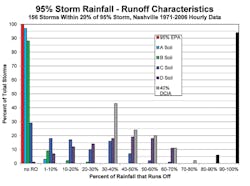
The percent capture approach has the same problem. For example, look at the impact of the 95% storm instantaneous capture in Nashville. Figure 8 has been constructed to give a visible “signature.” The figure shows continuous simulation results for the four HSGs for 156 storms that are within 20% of the 95% storm for Nashville (1.76 inches). The horizontal axis is grouped into ranges of percent of runoff for that storm. The vertical axis shows the percent of all storms that had that runoff signature.
So, for example, for HSG B soils, 88% of storms that could be called the 95% storm had essentially no runoff. Eight percent of the storms had between 1% and 10% runoff. Two percent of the storms had between 10% and 20% runoff, and so on. It is easy to see the right-hand shift of the “signature” of different soils as the natural infiltration rate decreases. This is natural.
It can be seen that HSG A soils often retain the whole 95% storm depth. It takes a long time to fall and the relatively high initial abstraction and infiltration rate can keep up with the rainfall. But there are some storms that have such intense periods within them that even HSG A soil has runoff. That is natural. Nature does it that way. HSG D soils almost never capture the 95% storm. That too is natural.
The gray and black columns depict what happens when directly connected impervious area is added to an HSG C soil site at 40% IA and 100% IA. The whole set of columns shifts right increasingly. This is human-induced change imposed on nature.
Under the hydrologic mimicry approach our goal should be to attempt to shift the signature back to the left to better match the natural site signature. Yet, capture of the 95% storm standard (the red column) implies that I have to design a structure that can capture that depth every time. That is not possible in nature. That standard, the one imposed on all federal facilities and a frontrunner in EPA consideration, is depicted as the red bar on the far left of the figure. Nature cannot attain that standard.
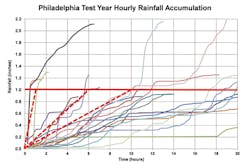
Figure 9 shows the same situation a different way. It depicts each of the storms in the test year for Philadelphia, PA, in a “worm plot” format showing the accumulation of rainfall during the storm. The storms have been arranged to show the steepest parts of the curve. It can be seen that a couple storms can attain the 1-inch capture requirement in an hour or less. Several more can do so in six hours. All the rest of the storms take more than 10 hours to accumulate an inch of rainfall. Nature would respond to the first few with runoff prior to the 1-inch accumulation because the input is faster than the natural “hose” can accommodate and there is no bucket to hold the rainfall. However, our criterion requires us to construct a bucket to capture the 1-inch storm–and since we cannot be sure how fast it will come we build it to hold an inch . . . resulting in overdesign if hydrologic mimicry is our goal.
There is a world of difference between saying “capture the 95% storm” and “capture 95% of the average annual rainfall.” Nature does the second fairly commonly. Nature almost never does the first.
Closing Remarks
You might be tempted to ask a couple questions right about now. “So what?” might be one of them. The outcomes and outputs that may miss the mark by a little or a lot include:
- a wrongly placed emphasis on big volumes instead of natural processes
- a wrongly placed emphasis on building on sites that infiltrate well instead of on sites that infiltrate poorly so hydrologic mimicry would be relatively easy to achieve
- practices that are sized wrongly, leading to either expensive oversizing or ineffective undersizing
- a need to mash up several design approaches to try to recognize the value of such things as trees and land preservation when credit is given only for capturing the first…
- lack of emphasis on laying out sites for natural runoff absorption using natural processes in favor of construction of structural solutions
You might also ask, “These approaches may have problems, but the alternative seems overly complex and involves continuous simulation, which is far beyond the grasp of the typical designer and developer, isn’t it?”
Well, maybe not. Stay tuned for next issue.
Reference
USEPA 2009. Technical Guidance on Implementing the Stormwater Runoff Requirements for Federal Projects under Section 438 of the Energy Independence and Security Act. EPA 841-B-09-001. December 2009.
