Utilizing GIS to Identify Potential Sources of Illicit Discharges
Eliminating illicit discharges is one of the most fundamental yet challenging elements of an effective municipal stormwater program. Unregulated discharges from industrial and commercial activities can cause pollutants to slowly accumulate and cause the receiving waterbody to exceed the in-stream water-quality criteria for its designated beneficial use. Worse yet, the acute toxicity of spilled materials can endanger public health, threaten other communities’ water supplies, or lead to fish kills, which are not only detrimental to the aquatic ecosystem but often sensationalized by the media. Once illicit discharges are identified, it is imperative to respond quickly in an attempt to eliminate them as soon as possible, and once the discharge has been eliminated those responsible must be held accountable.
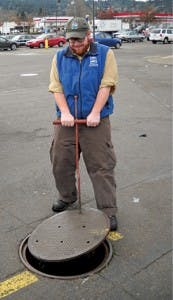
An illicit discharge can be discovered in a number of ways, such as dry-weather screening, ambient surface water or storm event sampling, infrastructure inspections, or notification by the public. When attempting to identify the source of an illicit discharge, time is of the essence as the responsible parties may take measures such as pressure washing or using a hose to flush the material through the system, both of which make it difficult to hold them responsible. Identification is especially challenging as the process of finding the source of an illicit discharge has generally been to follow the material upstream through the system in hope of identifying the source. This method of investigation can be both labor intensive and time consuming, especially in an urban environment with an underground conveyance system, which requires field staff to pull manhole lids, many of which are located on the street or in intersections.
In some instances, educated guesses can be made regarding the source of an illicit discharge. Municipal illicit discharge detection and elimination (IDDE) staff likely have historic knowledge of conveyance systems, may be familiar with the area, and possibly have access to a variety of sources of information such as the fire marshall’s database, stormwater and wastewater discharge permit files, and building permit records. However, the main drawback to relying on this information is that historic knowledge is lost with staff turnover; even someone very familiar with an area is unlikely to be aware of all of the potential sources. Additionally, when frantically attempting to respond to a spill, having to rely on multiple data sources takes additional time and can prevent all of the sources from being utilized.
Catalyst for the Decision to Use GIS to Identify Potential Sources of Illicit Discharges
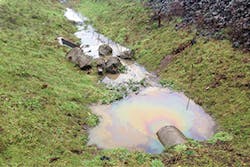
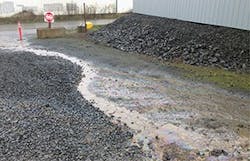
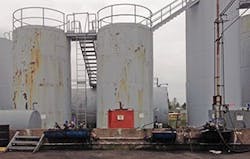
The city of Eugene’s decision to use a geographic information system (GIS) to identify potential sources of illicit discharges occurred in 2009 when and industrial facility’s aboveground storage tank leaked approximately 730 gallons of off-road diesel in close proximity to the stormwater conveyance system, which discharges to the Willamette River via a 90-inch storm sewer line. Although the spill was formally reported by the industry shortly after it occurred, it was believed that the majority of the material had been captured onsite and would be addressed appropriately. However, due to a previously unknown storm sewer connection from an antiquated private system and light rain overnight, some of this material was discharged to the Willamette River in an area with high public visibility.
Fortunately, in this situation the business that was responsible for the spill properly self-reported the release to the Oregon Emergency Response System in accordance with Oregon state environmental law. Without this notification, city staff (who had to be called in as the discharge occurred on a weekend) would have had to spend a considerable amount of time tracing the spill through the stormwater conveyance system in hope of identifying the source, because a 17-mile section of stormwater piping discharges to this outfall. This event identified the need for the City to develop a way to quickly identify what materials local businesses were storing onsite.
Creating a Database of Potential Sources of Illicit Discharges
Even if a municipality ultimately decides not to link this information to a GIS system, it is important to know what materials businesses are storing onsite and where these materials would go if they were to be spilled. The city of Eugene has created a hazardous material database that comprises information from the Toxics Right-to-Know Database (created by the city in 1996, requiring certain manufacturers to provide information to the public concerning the use and disposition of federally listed hazardous substances), General Industrial Stormwater Discharge Permit files, and Industrial Wastewater Pretreatment Permit files, which generated a list of industrial facilities that stored hazardous materials onsite. Once this list was created, the phone book and the Oregon Labor Market Information System were used to identify other businesses that had a high likelihood of storing significant quantities of hazardous materials onsite. These businesses included gas stations, auto body shops, paint stores, and dry cleaners.
The list of businesses was created in a Microsoft Access table that included each facility address, contact information, and information related to the hazardous material inventory. Each business was assigned a five-digit unique identification number, which was used as the primary key; the first digit in the number corresponds to the industrial activity that is conducted at the facility. For example: 5-,— was assigned to dry cleaners and 7-,— was assigned to gas stations. This method of assigning identification numbers makes it easier to update and cross-reference information in the database. To help cross-reference the database in other ways, there is a column for each part of the address (street number, street name, street type, direction), and capital letters were used for all text. By populating the database in this fashion, it made it easier to delete multiple entries and made it possible to utilize the city’s GIS data, which was in the same format.
Once the list of businesses was created, a list of commonly stored hazardous materials that could be easily identified at a stormwater outfall was added. The materials included are as follows: gasoline, diesel, motor oil, antifreeze, kerosene, formaldehyde, lubricant, solvent, paint, hydraulic fluid, acid, and chlorine. If the material was suspected to be present at a particular site, a “1” was entered into the column, and a “0” was entered if the material was not suspected to be stored onsite. There were a number of different materials that only occurred at a handful of sites, so a field entitled “Other” was created to account for these materials in the interest of creating a manageable table.
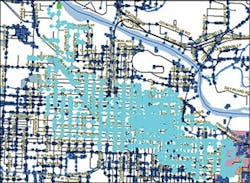
The locations these hazardous materials would enter the municipal storm sewer system in the event of a spill was identified by zooming to each industrial site and identifying the Structure ID of a nearby stormwater catch basin or manhole using ArcGIS. If a facility is located in an area where the stormwater drainage from the site flows into two different drainage basins, the site was entered into the data table twice so each of the discharge locations could be properly identified. The city has not mapped privately owned stormwater systems, and occasionally a connection that was present on the ground wasn’t displayed on the storm system geodatabase. In this event, the next structure upstream of where the connection was supposed to be was identified. The Structure ID of the stormwater outfall for each inlet was also added to the table so it could be used as a standalone document.
Connecting the Database to Existing Data and Creating a Geometric Network
A coordinate system was added to the database by using the Join tool, which is located in the Data Management Tools section of ArcToolbox. This join was based on the stormwater node feature class of the city’s stormwater conveyance system geodatabase utilizing the Structure ID of the nearby municipal catch basin or manhole. For the join to function properly, the “Maintain Fully Qualified Field Names” box must be unchecked in the General Settings tab under “Environments” in the dialogue box. This ensures that information from the data table does not overwrite existing GIS data in the event there is a field in the data table that matches one in the existing GIS database, such as street name, for example.
A geometric network was created in ArcCatalog by right-clicking on the MS4 feature dataset and selecting New Geometric Network. All of the needed feature classes were selected to comprise the geometric network, and all of the layers were selected to be complex edges. In a geometric network, complex edges allow each feature to be connected to a single point. In this instance, each feature in the stormwater conveyance system could be connected to the outfall. It was indicated that the features would be snapped to the geometric network, and a relatively low snap tolerance was assigned to prevent nearby features from being connected to the network. Some of the city’s stormwater is directed to groundwater via underground control structures, and it was important to prevent these structures from being connected to the stormwater conveyance system that discharges to surface waters, as this is not the case on the ground.
discharge can be identified using the Trace Upstream tool in
the Network Analyst toolbar.
When a line feature is created in ArcGIS, one of the pieces of information that is collected is which end of the line was drawn first. To assign flow direction, the upstream end of the pipe must be drawn first for each section of the conveyance system. Fortunately this was the case when the city’s stormwater conveyance system was digitized so sources and sinks could be assigned to the geometric network. Once the geometric network was created, flow direction was derived using the MyDirectionFlowSolver feature, which was downloaded from the ESRI website.
Identifying Potential Sources of an Illicit Discharge
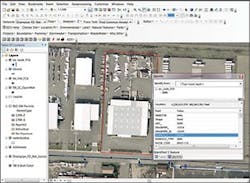
To properly display the data, the operator must first click the drop arrow next to Analysis in the Utility Network Analysis toolbar, select options, and choose selection in “Results Format.” The operator must then select the Add Edge Flag Tool and click on a stormline just upstream from where a spill was observed. Once the flag is placed, the operator selects Trace Upstream from the Trace Task drop-down box and clicks the Solve button. The section of the MS4 that drains to the point where the flag was placed will be selected.
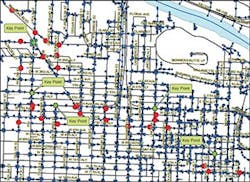
potential sources.
To identify businesses that are likely to store the illicit material onsite, the selected features can be sorted in descending order in the attribute table. Once the data table is sorted, a layer that contains only potential businesses needs to be created. This is accomplished by highlighting the records that indicate the material in question is not present onsite, right-clicking on the far left portion of the data table, and choosing the Unselect Highlighted feature. Now that the data table only contains records for businesses in the drainage area that are assumed to store the hazardous material onsite, a new layer can be created that contains only this information by right-clicking on the node layer in the table of contents, highlighting the Selection option, and selecting the Create Layer From Selected Features function. Once the new layer is created, it should be rendered so the locations can be easily seen and key points can be identified. IDDE staff can then inspect these key points to quickly identify the area where the illicit discharge is coming from and visit the businesses upstream from the key point location.
Illicit Discharge Follow-Up
As previously mentioned, if a business is responsible for an illicit discharge, it must be held responsible. The severity of any regulatory follow-up will depend on the volume and type of material discharged, actions taken by the business to minimize the volume of material discharged, the cause of the discharge, adherence to notification procedures, and compliance history. The repercussions of causing an illicit discharge could range from a verbal warning to a multi-thousand-dollar civil penalty, along with required reimbursement of costs incurred by the responding agency. It is important to note that the goal of enforcement actions is not necessarily to be punitive, but rather for the business to understand the severity of the situation and change its practices so the same violation does not happen again. Using GIS to identify potential sources of illicit discharges increases the likelihood of identifying the responsible party quickly and thereby preventing future illicit discharges from occurring.