My old friend Dr. Tom Debo, late of Georgia Tech and co-author of our textbook Municipal Stormwater Management, is fond of saying, “I love urban hydrology. They can never prove you are wrong, only inconsistent.” As a principal author of several state and local design manuals and as a past university teacher in hydrology, I have been repeatedly reminded of the black box (maybe black magic?) nature of urban stormwater hydrologic design, and the often minimal level of understanding of many designers who are sizing and placing infrastructure within urban neighborhoods and other developments every day. So this article is about understanding some of the basics of methods we have taken for granted for years. You might be surprised at what you find when you open the black box.
After offering some perspective on urban hydrologic practice, this article looks briefly at three icons of current urban hydrologic practice: the Rational Method, the SCS Method, and the 80% total suspended solids (TSS) removal standard.
Hydrology Is…
Urban hydrology is primarily a study of “how much, how often.” If you spend time around unsavory developers, you might frame urban hydrologic questions as “How high can I legitimately make the 10-year predevelopment peak flow so my post-development increase is small?” “What is the probability that this home will be flooded prior to my retirement to Costa Rica in eight years?” “How small can I make this detention pond and still meet the stated design requirement?” and “Why can’t this Double-Dip Stream Raptor remove 80% TSS?” Once I know answers to these questions, then I turn to the sister science, hydraulics, to answer the “how high, how fast” questions of elevation, velocity, and infrastructure size (not to mention home placement on a lot next to a stream).
Urban hydrology, as commonly practiced, is an inexact science at best. Most professional hydrologists would hold their noses at some of the methods commonly used. The reason is that the methods are a number of steps back from our best statistical estimate of reality. Urban hydrology is a compromise between accuracy and data availability. And as Murphy would have it, a densely populated urban setting is the one place a designer would most want to be accurate in flooding predictions, and is also the one place where accuracy is often least possible to attain.
Urban hydrology for quantity commonly attempts to estimate two critical things: peak flow, and the volume/timing of runoff (the runoff hydrograph) of which the peak flow is only the largest value. Let’s take peak flow, for an example. Without getting into statistics and arguments about the relative merits of various methodologies, it is generally conceded that having accurate gage records for a long period of record at my site of interest is the best way to estimate peak flow. That is our dream come true. We could then perform a Log Pearson Type III, or similar, analysis and estimate flows of any reasonable return period.
US Geological Survey statisticians tell us we need at least 25 years of records to estimate the 100-year storm with some reliability (and 10 years for the 10-year storm, 15 for the 25, and 20 for the 50). We shouldn’t overly trust any estimate of the 500-year storm except for that on the Nile River. No one else has had a sufficiently long period of measured record to actually and accurately estimate it. While half-time of the Super Bowl is the largest wastewater flow you will ever receive, there is always a larger flood event possible. If Noah floats by, we will all be in the floodplain.
And then I woke up!
In a typical urban setting those data are never available. Our first fallback position from this data Nirvana is to have reliable gage data at a location not too far up- or downstream from us, or in a very similar watershed in the area. We can then, through suitable ratioing of areas and flows, translate that information to our site. For example, if the regression equation available for our locale estimates the 10-year storm as
then through a simple ratio we can estimate our site’s peak flow.
We are still in the realm of actual flow data.
If we do not have any reasonable gage data in the area, then our next step back from reality is to use regression equations by themselves. These have been developed for much of the United States and take a form similar to Equation 1, though for some areas there may be some form of slope, and there may or may not be impervious area in the equation as a significant variable. The standard error of estimate inherent in many of these equations may be unacceptably high, being averaged from widely diverse conditions across many watershed shapes, sizes, slopes, land uses, etc.
Regression equations have stated limits on their parameter ranges and will have even larger errors for watersheds that are not “typical” in land use, slope, shape, or soil. Even simple applications can be troublesome. For example, at the confluence of two identical 1-square-mile subwatersheds, a single application of Equation 1 would give 1,218 cubic feet per second (cfs). Treating it as two separate 1-square-mile applications added together would give 1,519 cfs—a 19% increase based just on mathematics. Which is right?
When we do not have dependable flow data at all, or local regression equations do not in and of themselves apply, we then take the “big step” back and use rainfall data to generate estimates of flow. Rainfall statistical data exist in most places and, unless there are dominating orographic or water body effects, can normally be transferred some distance without undue loss of accuracy. This is not to say that specific storm data can be transferred very far for calibration purposes, only long-term rain gage data. There are, of course, many ins and outs of this that doctoral candidates have mined for years.
Arguably, the best use of rainfall data is through long-term continuous simulation, disbursed parameter, hydrologic models that can account for most of the important physical factors. These include factors that would affect the runoff volume estimate from the rainfall record (infiltration, initial abstractions, evaporation, base flow), and would affect the peak flow estimate (routing effects, roughness estimates, and various flow dispersion effects) between the raindrop impact point and our point of interest. Then, with a few measured storms to use for calibration and suitable statistical wizardry, we could generate a “synthetic” rainfall-runoff record and perform the same peak flow-return period analysis. We would then have our estimates of peak flows, and of runoff hydrograph shape and other basin response parameters—the most significant advantage being that we can then change land use and project any number of “what if” scenarios. Urban landscapes are not static.
For most urban sites, this process is way too hard and expensive, though some local governments have tried to simplify things by developing hard-wired, stripped-down, precalibrated versions of the process and “encouraged” its use by making it mandatory for the more important structures.
The rest of us, though, need take yet another step back from reality and transition into the “design storm” approach. Theoretically, there is a single storm that would produce the same size of conveyance structure, detention pond, or water-quality structure as a continuous gage record or long-term simulation model. Finding that storm has been the objective of several studies, though results seem not to be generally applicable. The design storm is then translated into a design outflow hydrograph through some suitable, normally linear, transformation, and out comes a hydrograph and a peak flow.
All uses of rainfall instead of flow data make the “Big Assumption.” We know that there is only one 10-year peak flow for our site. If we were able to ask some Omniscient Being, she would be able to tell us the current one-in-10-year peak flow to 10 significant digits. There is only one. Our problem is trying to estimate it. This is a problem, because there are an infinite number of combinations of all the variables within the watershed we have to estimate to try to arrive at that one peak flow. So we must make simplifying assumptions about everything that affects stormwater volume and that moderates its flow rate.
In a nutshell, perhaps the largest of these assumptions is that the 10-year rainfall depth, duration, and storm distribution we pick will produce the 10-year runoff. Our hope is that, through some miraculous application of the Central Limit Theorem and a bit of engineering judgment (a.k.a. luck on steroids), we can arrive at an unbiased estimate of the peak flow or outflow hydrograph. Perhaps, if we make enough estimates of enough factors, the errors in estimation, high and low, will average out to the right answer. This is where voodoo really comes in handy.
If we do not want to develop a rainfall-runoff model that generates a complete hydrograph, we can take another step from reality and estimate only peak flow. We could come up with a simple mass transfer scheme: Rain in minus some estimate of losses equals rain out. The most common mass transfer equation is the Rational Method.
So you can see we are starting with several strikes against us, hydrologically speaking, and better be careful with these indirect estimate methods—because we are designing flow systems that are contiguous to people, traffic, and habitable structures.
The good news is that, as Dr. Debo says, “Who can prove you are wrong?” Well, the Omniscient Being can, but is probably busy elsewhere. And a less omniscient lawyer may try, but if you are consistent, then the lawyer, too, will have better things to do.
The Rational Method
In the middle of the last century, when we decided that efficient drainage was the way to do stormwater and that curb and gutter designs were the right way to be efficient, we were in need of a method to quickly estimate peak flows to these pipe systems. The Rational Method beat out other methods because it is so, well, “rational.”
It is a simple mass transfer equation. It is accurate to the molecule (neglecting surface adhesion and in-storm evaporation) for flow from a pane of glass. Outflow (Q) is equal to inflow (iA), where “Q” is in cubic feet per second, “A” is in acres, and “i” is in inches per hour. And because 12*3,600 is almost equal to 43,560, the conversion from cubic feet per second to acre-inches per hour is close enough to 1.0 for most purposes. How convenient. As long as the rainfall duration is long enough for flow to arrive at the outlet from the farthest corner of the glass pane, we are in good shape.
With the Rational Method, there are only a few “knobs” to fiddle with: area, time of concentration, and C factor. It is a conveyance model for peak flow. Use beyond that is at your own risk—as we will touch on later.
The voodoo comes in when we have to begin to figure what to do if what we are dealing with is not a pane of glass but a mixed-use urban environment. There are losses, delays, undersized systems, and strangely shaped areas that are hard to represent. Because we are so scientific, we use a single, simple factor to account for all these potential influences: “C.” So the equation becomes
In 1980 (before some of you were born, I am reminded), my friend Dr. Ron Rossmiller wrote a paper in which he attempted to partition the C factor to account for all the major things that could factor into its estimate (Rossmiller 1980). It was a valiant effort and still has potential—if it were not so hard to estimate every single one of the sub-C-factors to begin with. As soon as the surface begins to look less and less like a pane of glass and more and more like a complex array of fields, parking lots, undersized culverts, clogged ditches, and mud puddles, the farther and farther away from reality our C factor becomes, and the more voodoo we must employ. For example, have we considered that C must also account for detention ponds (planned or otherwise) in the basin? They reduce peak every bit as much as infiltration losses.
This fact has led some local governments to limit the use of the Rational Method to 25 acres or less. Beyond that, there is a need for models, routing, measurements, subdivision of the areas, etc. Other places allow its use for 10 times that area. Are they right? How much voodoo can you stand? But they are consistent.
Just for fun let’s look at just one insidious problem with misuse of the Rational Method that bears pointing out. Let me illustrate with an example.
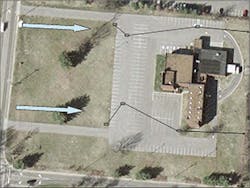
Let’s say a 6-acre site is two-thirds pavement and one-third grass and that the whole site drains to the back of the property as in Figure 1. When we apply the Rational Method for a peak flow estimate to the whole site, making standard assumptions for sheet flow and shallow concentrated flow along the path of the hydraulically most distant point, we arrive at a peak flow of 16.5 cfs. Simple enough.
However, when we apply the same method and standard assumptions to just the 4 paved acres instead of the whole 6-acre site, we arrive at a peak flow of 21.1 cfs—a 28% increase in peak flow for a 33% decrease in area. Why is that? Voodoo!
The reason has to do with the rate of change of the three variables (the “knobs”) that make up the Rational Method. While the area is being reduced by 33%, the C factor is increasing from 0.72 to 0.98 (a 36% increase), and the rainfall intensity for the shortened time of concentration goes from 3.82 to 5.38 inches per hour (a 41% increase)—which multiplies out to a 28% increase.
The good news is that this effect takes place only for certain kinds of sites that are small with some grassy open-space requirements. The bad news is that many sites are like this. And the worse news is that many experienced voodoo practitioners artfully extend the time of concentration out to the outermost grassy corner of the site with the justification that the very definition of “time of concentration” demands it.
For many communities, the Rational Method seems too unsophisticated. “So,” the common argument goes, “we need to be more scientific and exacting, and so we demand that our designers use the SCS (sometimes called TR-55) Method instead, because it is more accurate, right?” Well, let’s see.
The SCS (TR-55) Method
The SCS Method is actually a set of related methods originally designed by a group from the Soil Conservation Service (SCS, now the Natural Resources Conservation Service) and the Agricultural Research Service (ARS). Work began in the 1920s, and minor changes and redefinitions continue to present as the SCS method is used for more and more things never envisioned by the developers. It was developed to predict runoff from agricultural (i.e., undeveloped) lands (it was the Soil Conservation Service after all). It was compiled in the National Engineering Handbook #4, and more recently updated to correct some “erroneous” interpretations of the original SCS approach. Perhaps only reluctantly did the SCS develop Technical Report 55 in the 1970s and ’80s (in first and second editions) to meet the demand for an integrated method for calculating runoff hydrographs to route through those new detention ponds that were beginning to be all the rage.
In reality, the method was originally designed only to predict the volume of runoff from daily rainfall. Later, it was morphed to predict the direct runoff from individual rainfall events. Later still, it has been further morphed to predict rainfall losses and infiltration and used (or “ab-used” as some would have it) in continuous simulation models and for small stormwater-quality calculations.
In order to extend the original intent of the method to allow for single storm calculations, the SCS developed a coordinated set of tools, the key ones being (1) rainfall distributions (e.g., Type II storm), (2) losses of rainfall due to initial abstraction and infiltration (i.e., Curve Numbers), (3) a runoff unit hydrograph shape, and (4) methods to calculate lag time for the watershed. Let’s look at some of the ins and outs of each of these to discover exciting opportunities for voodoo hydrology.
Rainfall Distribution
To avoid the problem of developing multiple storm durations to reflect various sizes of watershed, the SCS developed a theoretical and nested approach. In this approach, a large number of intensity-duration-frequency curves (of the kind used in the Rational Method approach) were analyzed, lumped, and segregated by region. For any frequency storm, the most intense five-minute period for, say, the 100-year storm was placed in the center of the storm hyetograph. Then the 10-minute storm depth was determined, the five-minute depth subtracted from it, and the remainder placed adjacent to the initial block of rain. Then the 15-minute depth was assessed and a similar subtraction of the 10-minute depth took place, and so on. Different shapes were derived for different climatic regions in the United States (termed Types I, IA, II, and III).
In this way, any storm duration, as measured in both directions out from the center (the 12-hour point) of the SCS storm hyetograph, would contain the theoretically most intense amount of rainfall, distributed in the theoretically most intense way. Figure 2 shows a typical 24-hour storm hyetograph for the SCS Type II storm.
As you can see, the middle of the storm is very intense, and then the rain drops off quickly. Experience has shown several problems can be encountered with using this standard approach. Let’s take the Type II storm as an example.
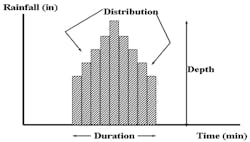
Time Distribution. Every storm has three factors (the Three Ds) that are related to frequency and to each other—depth, duration, and time distribution (Figure 3). We understand that depth and duration have a frequency relationship. There is, for example, an IDF (intensity-duration-frequency) curve for the 100-year storm that relates the depth and duration. The longer the storm, the less the average intensity. But there is nothing comparable that relates the intensity of the distribution to frequency.
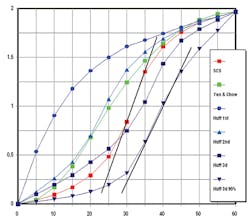
Do these storms match reality? Huff (1967) and Yen and Chow (1980) plotted the time distributions of the heaviest storms in Illinois and around the country (respectively) and, in Huff’s case, performed a frequency analysis. The time step was fairly long, which can influence the results somewhat.
Figure 4 shows several of these distributions, and the theoretical SCS Type II S-curve. Note that the SCS storm is more intense (steeper) in its central portion than even the 10% probability storm of Huff. That is, the distribution of the SCS storm has a probability of occurrence, by this comparison, of maybe less than one in about 50. So, while we may have the duration and depth theoretically correct, the distribution of the storm with the steep center is very rare and can lead to a peak flow prediction that may be high.
Areal Reduction. If the Type II storm is applied over a large area, there is often a tendency to overpredict the runoff. For smaller areas, nature can be quite intense, Katrina notwithstanding, but over a large watershed the ability of nature to follow the IDF curve tends to break down. Recent information from radar-based rain estimates gives a much faster falloff of intensity with area increase than even older US Army Corps of Engineers curves predict. For the kinds of thunderstorms that cause small urban areas to flood, it is often on the order of less than a mile or two rather than 30 or 40 (Curtis 2001).
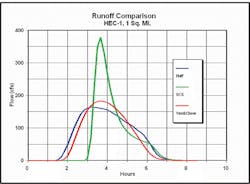
Figure 5 shows the runoff from a 1-square-mile watershed for each of the three methods. Note that the SCS method, applied unadulterated, creates a runoff hydrograph that is almost twice as high as the other two. Which is right? Only real data can help us.
An interesting exercise in a locale where the SCS method seems to overpredict peaks is to use, for example, the Huff rainfall distribution and determine the peak flow from undeveloped land using the SCS method. Theoretically, the SCS method should be more accurate for peak flow prediction from undeveloped land than the Rational Method. After all, it was derived from such data. When we do this exercise, using, say, the Yen and Chow rainfall distribution, we obtain relatively low peak flows. Since we know A, Tc, and Q, we can back out what the Rational Method C factor would be to produce such “predevelopment” peaks. If done, the C factors, especially for flatter slopes and A and B type soils, can be an order of magnitude lower than the 0.2 to 0.4 commonly used for such conditions. In fact, it takes D soils and steeper slopes to match our common predevelopment C factors.
This is a good thing, right? It means that the Rational Method may tend to provide conservative pipe sizes because the grassy areas have high C factors. That may be true. Pipes are never built as designed and are partially clogged in any case, so some potential and theoretical oversizing is good. But what about when the Modified Rational Method is used for detention design? In that case, the oversized outlet pipes may contribute to detention ponds that are significantly undersized. The outlet pipes are too big. And when the pipes are brought into conformance with lower C factors, then the pond volumes are still too small, because the method does not account for the volume in the long hydrograph tail that exists. This may apply to thousands of ponds out there today, and hundreds that are still designed this way every year.
Note that there are a lot of “mays” and “mights” in the above detention discussion. But, if it is found that the SCS rainfall distribution is not applicable, then sizing ponds using the Modified Rational Method is suspect. Routing real storms through real ponds is always best.
These rainfall issues have caused some local governments to mandate their own local design storm, forbid the use of the SCS rainfall, mandate method adjustments to try to match data or regression equation results, or just bite the bullet. Such issues have also spurred some designers on to become inventive (voodoo) practitioners in their hydrologic design approach using the remaining “knobs” in the SCS method. Let’s look at some of those SCS Method knobs.
Rainfall Losses
Hydrologists normally think of losses of rainfall in terms of initial losses (called “abstractions”) and losses due to infiltration.
At the core of the SCS Curve Number method is a very simple idea. SCS scientists reasoned that when infiltration depth was small compared to soil saturation, then runoff would be small compared to rainfall. And as infiltrated rainfall began to approach the soil saturated capacity, the runoff depth would begin to approach the rainfall depth. The basic proportionality relationship, the center of the methodology, is demonstrated in Equation 4.
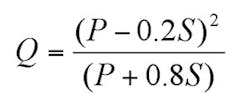
Then, knowing that infiltration (F) is equal to effective rainfall (P-Ia) minus rainfall lost to runoff (Q), and taking an average initial abstraction (now be careful) as 0.2S based on median measured values, the familiar SCS P-Q equation emerges:
All values are in inches. The equation was developed from daily rainfall data across many, mainly small, rural watersheds for which only basic watershed data were readily available. It was developed from recorded storm data that included the total amount of rainfall in a calendar day but not its distribution with respect to time. P and Q were known and S calculated for the Ia = 0.2S condition. The SCS runoff equation is therefore primarily a method of estimating direct runoff from 24-hour or 1-day storm rainfall, though shorter durations are routinely used for individual storm calculations.
Research has shown that the value of 0.2S is not correct for all circumstances. There is much scatter in the data. Others have suggested 0.1S better fits even the SCS data. Other values can be used for initial abstraction, though if that is done, whole new sets of CN curves should be developed. So no one ever uses a different value…correctly.
Because we cannot measure S (if it is even a physical property) every time we want to do a design, SCS derived a relationship between S and a value derived from physically measurable characteristics called the Curve Number:
Curve Numbers vary between about 40 and 95; the higher the Curve Number, the more runoff per unit of rainfall. The Curve Numbers reflect all physical aspects of land use, soil, and antecedent moisture within the soil—and everything else. They are the “C factor” of the SCS Method.
Numerous authors have criticized the SCS Curve Number method for a number of reasons, many of them valid. For example, under this method infiltration varies with rainfall rate. This is not really true except in the most indirect sense. Yet there is a good reason for the use of the SCS method—it seems to work fairly well. Here is one reason.
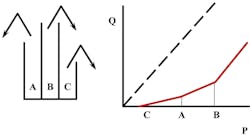
Boughton (1987) demon¬strated that the P-Q equation (Equation 5) is a special case of a spatially varied, saturation overflow model, and has derived curves similar in form to those from a plot of Equation 5 from purely physical reasoning. Figure 6 illustrates this reasoning. The watershed is considered to consist of a large number of “buckets,” each of which produces runoff after it has become filled. The buckets are of different sizes. Each size range of buckets begins to produce runoff at a different point in the storm. When all the buckets are full, runoff equals rainfall, and the rainfall-runoff line in Figure 6 approaches 45 degrees. For the simple case of three buckets as illustrated in the figure, line CA results when bucket C is full and begins to produce runoff. When bucket A fills the line steepens (line AB), and when bucket B is full the runoff begins to equal the rainfall and the whole watershed is producing runoff.
So the curve in the figure represents a specific set of watershed characteristics to which we could assign a name or number. Since numbers are easier, different characteristics of average watershed bucket size were assigned “Curve Numbers.”
The three major things that change the bucket size and the Curve Number are
- soil type (termed Hydrologic Soil Group by Musgrave as “A,” “B,” “C,” and “D,” with D being the smallest bucket);
- land use—in an urban setting, the more imperviousness, the smaller the buckets—and
- Antecedent Moisture Condition (AMC)—originally thought to represent how full the buckets are at the start of the storm in question with three options given by SCS (termed “I,” “II,” and “III”).
AMC is now called Antecedent Runoff Conditions—ARC. The ARC adjustment has come into question and is now thought of more as the upper and lower bound of the randomly distributed Curve Number—more of a suggested upper and lower limiting envelope.
Theoretically the line shifts to the right for drier initial conditions, for greater initial losses, or for more porous soil and less intense impervious cover. Curve Numbers can also be adjusted for detention within the watershed and for disconnection of impervious areas. As in the Rational Method, anything that can affect the final answer must be accounted for. But in this case there is an interplay between volume of runoff and peak flow of runoff to also consider. More knobs.
Now the real voodoo starts.
Because actual Curve Numbers were derived from observed data, the SCS method should shine for situations that look like rural conditions, just like the Rational Method should shine for situations that look like panes of glass. Too bad an urban development stitches together fields and parking lots and connects them with myriad over- and undersized pipes, ditches, ponds, and potholes.
For example, what soil classification is urban soil? Studies by several researchers have shown that urban soil can vary greatly from its original mapped condition. For soil areas that were compacted by equipment or have lots of human traffic, the infiltration is hardly better than concrete (which, by the way, can have a fairly high loss rate through its cracks and into the gravel below!). SCS, having given up, just terms it “urban modified.”
Additionally, with an urban setting there is both runoff and “run-on.” Run-on results when impervious areas are disconnected from outfalls and the discharge is directed (intentionally via sheet flow or unintentionally) across grassy areas. Data from the American Society of Civil Engineers (ASCE) and from California studies have shown that there can be significant reduction of average annual runoff due to infiltration of this run-on into the grassy areas. This run-on can thus significantly reduce the pollution load through reduction of polluted discharge volume—even if the measured in- and outflow concentrations change little.
As with the Rational Method, the same sort of situation with paved versus grassy areas exists with the SCS method. For example, for a 20-acre site half paved and half grassy, the weighted CN is 79, and the 100-year storm, using a hydrologic model, Type II storm, and 24-hour duration, is 88 cfs. But if the site is broken into sub-basins, one paved and one grassy, and then combined at the outlet, the peak flow becomes 104 cfs—an 18% increase based just on how the system is modeled. When we look at the detention storage requirement under both approaches, the lumped watershed approach actually requires 12% more detention volume than the split approach in this case. SCS giveth and SCS taketh away!
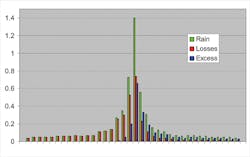
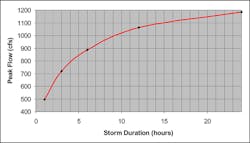
A designer does not have to use the whole 24-hour storm. In fact, some very good voodoo high priests have found ways to reduce the peak flow by simply reducing the storm duration. Look at Figure 7. This is the rainfall-losses-excess plot for a six-hour Type II storm for a 1-square-mile drainage area.
Notice that at the peak period of rainfall the losses are fairly high. In fact, the rainfall is 1.4 inches and the loss is 0.74 inch. However, if we take the full 24-hour storm, keeping all else the same, the loss at this same time increment is only 0.57 inch. Why is this?
It has to do with the initial abstraction and the way infiltration is calculated. Ia is a fixed depth and must be satisfied before there is any excess rainfall or runoff. One problem is that when a shorter duration is used the fixed Ia amount is large compared to the rainfall total and “eats into” the peak.
Then the infiltration calculation begins using Equation 5 with incrementally increasing rainfall amounts (P). Each successive time increment is subtracted from the previous total to give the incremental total runoff. The loss is then backed out. This duration reduction is an artificial way to reduce the peak flow by simply reducing the total rain and allowing the SCS method to do its thing.
This has a great impact on peak flow. Figure 8 shows a plot of storm duration versus computed peak flow for the 1-square-mile watershed using HEC-1.
From this figure we can see that almost any peak flow can be calculated given the “right” set of assumptions for storm duration. Is 24 hours right? The median storm duration in the eastern United States is about six hours. Is that right? The “effective” storm duration based on SCS research is about 170% of the time of concentration. So, in this case, is a two-hour storm duration right? Voodoo can tell us!
Unit Hydrograph
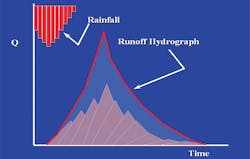
Linear hydrologic theory says that, once we have computed multiple blocks of excess rainfall (as in Figure 7), we can translate each of these small blocks into small runoff hydrographs, add them together (taking care to shift each block forward in time), and end up with the total storm runoff hydrograph. The peak of each little hydrograph varies with rainfall amount, while the shape proportions, being dependent only on watershed characteristics, do not change (or so we say). Figure 9 shows this “convolution” process.
In order to do this, we need to get a typical runoff hydrograph shape to convolute a unit of excess rainfall—called the “unit hydrograph.” SCS derived a unit hydrograph shape for a rolling-hills kind of topography. Figure 10 shows the triangular version of this hydrograph.
Using simple mathematics we can derive key equations for this SCS shape:
Vol = Qp(T+B)/2 = 1-inch depth
and B = 1.67T
then solving for the unit hydrograph peak flow realizing that A is in miles and T in hours:
Qp = 484* A/T
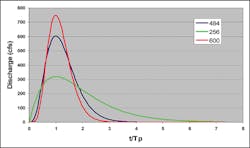
The key parameter in the shape—the “484”—depends wholly on the assumption that the duration of the tail of the unit hydrograph is 1.67 times the duration of the rising limb—good for rolling hills. This is certainly not the case in flat areas and in the mountains. Areas in Florida mandate a value in the 200s in order to better fit observed data, and SCS has stated that a value of 600 beter matches steep areas.
However, you cannot simply change the value. Recall that the area under the hydrograph must be equal to 1 inch of runoff from the whole watershed. So the whole shape has to change. This error has been made in a number of watershed studies and applications where the designer simply, and erroneously, changed the shape factor without changing the overall shape to retain the 1-inch volume. Should you adjust this factor to account for your watershed’s topography? Only a voodoo high priest (or reliable data) can say for sure, but consider the fact that many development sites are graded flat.
A mathematical equation to approximate different unit hydrographs for different peaking factors can be obtained from:
Where:
q = discharge at time t/Tp
qu = (PF * A ) / (Tp) = unit hydrograph peak rate of discharge (cfs)
PF = peaking factor
A = area (mi2)
d = rainfall time increment (hr)
Tp = time to peak = d/2 + 0.6 Tc (hr)
TC = time of concentration (hr)
X = 0.8679 * e(0.00353*PF) – 1
Figure 11 shows a plot of three unit hydrographs with peaking factors of 484 (standard), 256 (standard in some parts of Florida), and 600 for a 1-square-mile watershed (A=1).
Interestingly enough, the “Universal Rational Method” contained in some commercial software packages has a unit hydrograph that uses the Rational Method peak value, and the time of concentration as both the rising and falling limb duration (T=B) equivalent to a shape factor of 700. That would be a very steep parking lot!
Lag Time
Lag time is a weighted time of concentration and is related to the physical properties of a watershed, such as area, length, and slope. SCS warns against a simplified consideration of lag time as simply a calculation of a theoretical velocity of a segment of water moving through the drainage system. In hydrograph analysis it is defined as the time from the center of mass of the rainfall to the peak of the outflow—except when it is a USGS lag time. The USGS defines lag time in most of its regression equations differently, as the time duration from the center of mass of the rainfall to the center of mass of the outflow. This will lead to errors in calculation if methods are mixed unless the time is adjusted based on the shape of the outflow hydrograph. Time of concentration is defined as the time of travel for water falling on the hydraulically most distant point in the watershed to the outlet. Theoretically, the SCS lag time for the standard unit hydrograph is 0.6 Tc.
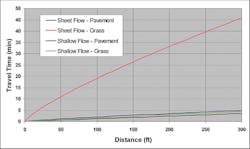
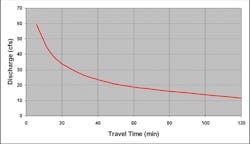
The SCS method divides up the travel time calculation into segments of like flow. Normally this includes a sheet flow, shallow flow, and stream or pipe flow segment(s). As in the Rational Method, the actual calculated peak flow is sensitive to the lag time estimate. And the lag time estimate is most influenced by the grassed area sheet flow component. Figure 12 shows the travel time for sheet flow (paved and grassy) and shallow concentrated flow (paved and grassy) for a slope of 0.005.
For urban sites where there is not a long river segment, the grassy sheet flow component dominates the lag time calculation. It is an order of magnitude higher than any other component (though there is considerable debate about the accuracy of the grassy shallow concentrated flow value). This means that, using engineering judgment (and voodoo), we can radically change the peak flow off of our site by how we factor in the grassy sheet flow component both in terms of length and dominance. I have already shown, in the Rational Method discussion, that sometimes leaving off the grassy portion of the watershed entirely (and its time of concentration) gives a higher peak flow than including it. The same is true here. Figure 13 shows the sensitivity of a peak flow calculation using the SCS methodology to travel time for a 20-acre site with an average slope of 0.005 ft/ft.
Summary of the “Knobs”
At this point it would be good to stop and summarize the various legitimate adjustments that can theoretically be made to the SCS method for any given site. Table 1 provides this summary. There are other adjustments that were not discussed above; a couple of the more important ones are included in the table.
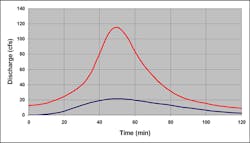
To demonstrate the potential range in knob adjustments to the method, an urbanized site is developed. In Case I, three key variables are adjusted within acceptable ranges to give the lowest potential peak flow. In Case II, the three are adjusted to give the highest potential peak flow.
The site is 20 acres with original B soils. It is 50% impervious with grassy areas upstream. The overall site slope is 0.005. Figure 14 shows the runoff hydrographs with peak flows coordinated in time.
Case I—lowest possible legitimate peak
- Maximize grassy sheet flow – Tc = 53 minutes
- Use original soil at ARC I – CN = 63
- Use two-hour storm duration
Case II—highest possible legitimate peak
- Minimize grassy sheet flow – Tc = 20 minutes
- Use urban compacted soil at ARC III – CN = 96
- Use 24-hour storm duration
From the output, we can see that the peak varies from 21 cfs to 116 cfs—an order of magnitude change. The excess rainfall varies from 1.15 inches to 6.91 inches. Recall that only legitimate estimates have been made within the accepted ranges of key variables in the SCS methodology, and even at that not all knobs were taken advantage of.
There is one more aspect of the SCS method that needs discussing—that of using the method for water-quality calculations.
Water Quality and the SCS Method
The SCS method is designed for use with the more extreme rainfalls. Water-quality calculations are designed to focus on the many small storms that carry, on an average annual basis, the bulk of the pollution. This sets up a basic problem that the SCS itself warns about in TR-55:
- The CN method is less accurate when the runoff is less than 0.5 inch, and it is suggested that an independent procedure be used for confirmation.
- The CN needs to be modified according to antecedent conditions, especially soil moisture before an event.
- The effects of impervious modifications (especially if they are not directly connected to the drainage path) need to be reflected in the CN.
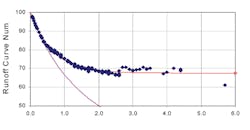
Figure 15 shows the variation in calculated Curve Number (remember we normally consider the CN a constant for any watershed) by rainfall depth for a typical watershed. In these cases the rainfall and runoff volumes were measured and the CN derived from a solution of Equation 5. Notice that the Curve Number begins very high and then, in this case, at a depth of about 2 inches levels out to the “design” value for this watershed. There are various reasons put forward for this including a “bias” argument and the simple realization that, while there are initial losses, some runoff always gets through for all but the smallest storms (maybe 0.1 inch or less). But the SCS method requires satisfaction of an initial loss prior to any runoff occurring.
Figure 15. Curve Number Deviation
Source: Runoff Curve Number Method: Beyond the Handbook. Joseph A. Van Mullem et al.
This situation has caused designers to go in several directions.
The most common direction is to derive a method equivalent to the Rational Method but for volume of runoff instead of peak flow. The surrogate for the C factor is a term called Rv. It is the ratio of runoff volume (in inches) to rainfall volume, or Q/P. It can be considered a water-quality version of Equation 5. It can be shown that Rv actually varies with depth of rainfall for a number of reasons, not the least of which is the decreasing influence of initial abstraction with increasing depth. However, the scatter of values at the lowest rainfalls (where initial abstraction predominates) and the probability of relatively large measurement errors make such variation hard to quantify—and it is ignored.
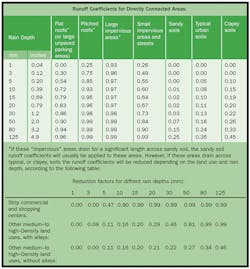
There are more complicated, and more accurate, ways to estimate Rv with the best probably being developed by Bob Pitt (1987) and represented in Table 2.
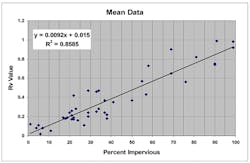
A more simple equation was developed by the Washington DC Council of Governments (Schueler 1987) based on a plot of National Urban Runoff Program (NURP) and local data using the mean values of Q-P. Reanalysis of the corrected original data gives a somewhat different result than that put forward:
Figure 16 shows a plot of the mean data.
Some cities, probably reasoning that they want an historically representative value and not a value that would mathematically return the historically calculated total runoff, use the median and not the mean. The median can be a better estimate of central tendency for data with small numbers of values that might otherwise be skewed by a couple large or small values. Originally the data were fit with a second order polynomial equation. More simply, the linear equation for the median is (note that until I > 2.24% there is no runoff – Q=0):
Another common approach, as shown in Figure 15, is to force the CN to be some larger number and use the SCS method as is. Equation 5, solved for CN is:
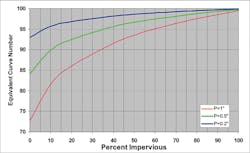
If the Equation 8 relationship between Q and P is substituted into Equation 10 a relationship between CN and I can be developed for any P. For example, Figure 17 shows such a relationship for P=1 inch, 0.5 inch, and 0.2 inch.
Of course all of this is just an artifice to be able to tap into the machinery of the SCS method—voodoo. But that machinery can be useful. For example, some best management practices require a calculation of the peak rate of runoff for water-quality purposes. This can be a problem because the storms tend to be very frequent and of relatively low intensity. The right way to do it is long-term continuous simulation to determine the appropriate peak flow that would intercept the correct total volume of runoff on an average annual basis, or for shock loading situations, for a critical storm runoff. But again, that is too hard for everyday designs, and, short of a local community performing that analysis, voodoo can come to the rescue.
We can use the SCS peak flow relationship and Equations 8 and 10 to derive a simple estimate of such a peak flow. The SCS peak flow equation is:
If we recognize that these situations are almost always from small highly developed areas we can use 100% impervious. In that case and for Type II storms things simplify:
- qu is 1000 (Exhibit 4-II in TR-55)
- Rv is 0.935
Then, using A in acres, we get:
Qp = 1000/640 * A * P * 0.935
= 1.46 AP
That is, the peak discharge is 1.46 cfs per acre per inch of rainfall. In Georgia, where the 85% storm is used (P=1.2 inches), the equation becomes:
Qp = 1.75 cfs per acre
When we cross the threshold from quantification of stormwater runoff to quantification of stormwater pollution, the opportunity for voodoo hydrology expands exponentially. We will end this article with a brief look at one of the most cherished icons of stormwater-quality management: the 80% removal of TSS standard.
The 80% Removal of TSS Standard
Overview of TSS as a Standard
Many more experienced scientists and engineers have addressed this topic in a variety of places in a myriad of ways. See for example the article in the July/August 2005 issue of Stormwater magazine by Kayhanian, Young, and Stenstrom (2005). My goal is not to regurgitate that discussion but to help us see clearly what we mean when we say 80% TSS removal and to sort out some of the voodoo.
First of all, let’s state up front that using total suspended solids as the measure of urban stormwater pollution is not a great idea—but it is both the best among not-so-great options and currently the most commonly used parameter across the United States. The suspended sediment concentration (SSC) test may be better, but it needs a lot of work to supplant the TSS test. TSS does not well account for that part of the sediment that saltates (hops and skips) along the channel bottom and comes out of suspension too fast for the test to catch. This bedload can constitute a significant portion of the solids moving through the system, depending on the combination of source material abundance, flow shear, material size distribution, and inherent turbulence in the system. If I am trying to determine the suspended sediment load in the stream, then SSC is clearly better. If I am trying to find a predictor of relative pollution—some convenient measuring stick—then the jury is still out.
Also, TSS is made up of both organic and mineral components, meaning, for example, that runoff from a forest could have a relatively high TSS but have it made up of natural organic components rather than sediment. TSS may be a relatively good indicator of most particulate pollutants (chromium seems to be a noted exception), because many of them vary, in some positive way, with TSS and are measured as part of TSS. But high TSS does not necessarily mean high lead, high nutrients, or high anything but measured suspended sediment.
There is also great scatter in the data. One farmer hanging his disc over the streambank to get that last crop row in when working his field, or one large site development with failing silt fences—just prior to a measured rain event—can send the measured value an order of magnitude above the median measurement. An event that just happens to exceed the critical shear value for a stream flowing in uniform bed and bank material can mobilize tons of sediment not disturbed by lesser events. There are also many reasons for data scatter that have nothing to do with physical realities and everything to do with sampling errors, laboratory errors, and the use of different analysis methods. Thus, pretending to be overly accurate is voodoo of the worst sort.
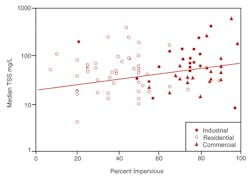
As a working example, Figure 18 shows median measured TSS concentration data from North Carolina plotted against impervious percentage (CH2M Hill 2000). The red line is the equation “fit” to the data and used to develop loading prediction tables:
80% TSS Removal
In a perfect stormwater-quality world we would know five key things:
- Every pollutant of concern for every stream in or downstream from our site
- The assimilation capacity of the receiving stream for the pollutants of concern
- The loading of those pollutants from our site under all pre- and post-design conditions
- Our allowable allocated loading of the pollutants in question from our site
- The combination of design approaches (e.g., Better Site Design or low-impact development) and controls (e.g., wet pond, bioretention, filter strips) that will limit the loading of the pollutants of concern from our site to below the allocated amount.
This is almost never the case. It is like having peak flow data at our site. It is Nirvana approximately attained by only a few with budgets to monitor and model a specific site. Most streams do not have an accurately estimated assimilative capacity for the suite of key pollutants of concern. We can calculate the estimated loading and probability of exceedence from our site using simple approaches and event mean concentrations—but it is very rough, and effective monitoring data are necessary to get within reality. Our individual allocation target is almost never calculated; and for stormwater we may hope numeric standards are still years away. And finally, the ability of specific controls to remove the loadings to the target value is problematic for a specific site, even if specific controls are becoming better understood in aggregate.
For a specific site of high importance, where we can afford to do the requisite monitoring and the development of a targeted pollution removal design, we can attain a rough ability to meet specific tailored requirements—and should. But that is not the problem facing local governments. They need a criterion that is applicable, in some appropriate way, to every site within their jurisdiction. For the vast majority of locations and sites, there is a need to establish some sort of “common denominator” of stormwater-quality design that has a “maximum extent practicable” (MEP) feel to it, but without either requiring expensive monitoring or stipulating numeric standards as a compliance measure. This is probably the most proper use of the 80% TSS removal idea.
The idea of “percent removal” is popular but poor science. For example, if I have distilled water entering my stormwater control, no amount of design will attain 80% removal—this is because 80% of zero is still zero. There is nothing to remove. On the other hand, if I have coarse-grained mudflow coming off of my site, then any detention pond will attain 80% removal of TSS. The percent removal is totally dependent on the size distribution and concentration of the pollutant in question, say TSS, entering the structure and on the structure’s ability to deliver an effluent that is 20% of that concentration. As stormwater expert Eric Strecker says, “This criterion would suggest we should all shovel mud onto our parking lots to make it easier to meet.” The best criterion is to specify an effluent limit, and the world is probably moving in that direction, if the limit can somehow be uncoupled from the potential numeric standard compliance violation and monitoring ramifications. But let’s see how we may state things in terms of percent TSS reduction without undue voodoo.
Returning to Figure 18, we could observe and state that, for our purposes, a representative TSS concentration is 100 milligrams per liter for developed urban land. We could also say that 20 milligrams per liter is an appropriate value for undeveloped land—or land in a predevelopment condition. Thus, it may be an appropriate target for effluent from a stabilized developed site for North Carolina. So then our goal is to reduce a nominal 100-milligram-per-liter TSS concentration to 20 milligrams per liter or better. And that looks like 80% TSS removal for the standard or representative case. It is our lowest common denominator.
What structural controls can do that?
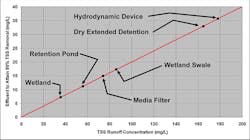
Figure 19 shows a plot of a site’s runoff concentration of TSS versus the required effluent to attain 80% TSS removal.
Also shown in the figure are the general removal capabilities of some common stormwater structural control categories based on influent and effluent concentration data (not total loading). For runoff with a concentration of TSS less than about 30 milligrams per liter, no normal structural control on Earth can attain 80% TSS removal. For runoff in excess of 200 milligrams per liter, a large number of controls can achieve the standard. It is generally conceded that there is a set of controls that can attain a median value of 20-milligram-per-liter effluent or better on a fairly consistent basis, though reliable and comparable data do not exist for all of them to the extent one would desire. These controls (not listing the multiple variations on the basic theme) include
- stormwater ponds;
- stormwater wetlands;
- bioretention areas;
- sand filters;
- infiltration trenches; and
- enhanced swales.
Will each one attain 80% TSS removal at each and every site? Certainly not—that’s voodoo. Will they generally attain 80% removal of TSS from sites that have 100-milligram-per-liter or greater concentrations of TSS flowing into the controls if properly designed, constructed, and maintained? Yes. So, in this situation, we can set up a design criteria standard as attainment of 20-milligram-per-liter TSS or better (and related removals of other associated pollutants). We can express this standard in a number of ways, one of which is to state, “Each site design shall, as a goal, attain a minimum of 80% removal of TSS. This goal is presumed to be met through the use of the following controls.” That may be the most misleading way to state the standard, but it is the most common.
The above list of six categories of structural controls (BMPs) all can meet the standard and can be approved if they are designed according to a set of strict criteria. We might call these controls “The 80% Control Club” or something similar. But it is a proper name and not a measurement of actual removal. What that title means is that they can meet the implied standard. We could assign pollutant removal rates to these, and other, controls and then allow a designer to develop a weighted average across their site, as long as the total site attains 80% TSS removal. This approach would open the way for all kinds of controls—each assigned a nominal TSS removal rate based on the standard conditions—even the “Double-Dip Stream Raptor.”
To encourage the use of “green design” layouts, we might even come up with an approach that gives TSS removal credit to green designs, such as disconnection of impervious areas for sheet flow across low-traffic grassy areas, specially designed vegetated channels, sheet flow across buffers, and natural areas set aside in conservation easements. For example, Georgia has allowed the “80% TSS removal” moniker to be given to such site layout practices if they follow strict design guidelines. The reason for this is that these layouts may, in fact, attain 80% removal of TSS through a combination of load removal and concentration removal, and they have other benefits.
Load removal has to do with the fact that up to, say, 40% of the total runoff volume flowing through these sites infiltrates, with the result (neglecting resuspension) of up to 40% of the runoff having 100% TSS removal. If the other 60% of the runoff volume (up to the design water-quality rainfall depth) can be treated by these sites to attain about 67% removal, then the total removal is 80%. When we consider the fact that these practices require little maintenance, rarely fail, are natural and inexpensive, are built into the site, and replenish the groundwater, a backstage pass to the 80% Club may be warranted.
If other pollutants become a concern, then parallel standards can be developed based on general loading information and structural control removals. In these cases, the developer would need to meet each pollutant’s standard just like the TSS standard.
Sounds simple enough to avoid most of the voodoo (not to mention the doodoo). We need to be clear, though. In order to avoid becoming voodoo practitioners, we must remember that we are talking about general common denominator design criteria using one representative constituent (TSS), at a representative runoff concentration (100 milligrams per liter), and a typical ability of categories of controls to meet a specific effluent objective (20 milligrams per liter). It may be MEP, but it is not tailored design and may not be sufficient in every situation. It is not applicable to other places in the United States unless they do their own analysis. It can be just so much voodoo otherwise.
Conclusions and Recommendations
What conclusions can we draw from all this talk of voodoo hydrology? One colleague, after reading this article, considered a career change to day trading—reasoning it had fewer unknowns and was less risky.
First of all, we must understand that urban hydrology is an inexact science where we are simply trying to get close to the right answer. We are dealing with probabilities and risk, a changing land-use environment, and many real-world factors that can alter the answer. The applications we may encounter can vary radically. Therefore, it behooves us to better understand the inner workings of the black boxes we commonly use. And we should understand how the common computer packages we use for design employ these methods.
As local governments, we should establish, very carefully, appropriate application of the most common tools (these and others) and require consistent adherence to the best science available. We should not be reluctant to disallow inappropriate practices or application packages even if they have had long use in our local community. For example, use of an unaltered Modified Rational Approach for detention design should be checked against better methods and adjusted as appropriate to give reasonable design parameters. Nor should we employ unrealistic overdesign in an attempt to cover all eventualities. I know of one community that required 100-year in-bank ditches everywhere within a residential subdivision. The result looked like miniature grand canyons everywhere with a meandering trickle stream somewhere way down in the bottom attacking the toe of the crumbling banks.
Specific recommendations include:
- To the extent practical, local communities or collections of communities should seek to “calibrate” standard methods to local conditions. This can be done using measured data and regression equations. Alternately, other more appropriate hydrologic methods can be used as a substitute for parts of the common methods. For example, some communities use different rainfall distributions, infiltration methods, or modified Curve Number charts.
- Local communities must understand how voodoo practitioners can “cheat” with the various methods and must establish ranges of applicability for the “knobs” in the various methods. For example, does sheet flow really travel 300 feet across grassy areas on steeper slopes? Not in this universe.
- For the most important hydraulic structures in the community (e.g., large ponds, dams, channels), more exacting standards should be required, including continuous simulation and making maximum use of measured data.
- Use of “percent removal” criteria should be carefully qualified using the best science and monitoring information available—again calibrated to the local area.
- A local community should recognize that not all structural controls are created equal and should establish a pollution-reduction criterion that is reasonably effective and does more than hand waving. Define MEP in a way that can be reasonably attained, reasonably maintained, and easily reviewed. No one wants to argue over every site.
And, finally, look to further automation in our ability to simply and accurately perform better and more accurate calculations. The day is fast approaching when we all will be able to model whole systems using continuous simulation models hard-wired to our local area, use drag-and-drop design approaches, practice “what if” analysis on the fly, perform effective reviews, and let the computer do the crunching while we do the thinking.
That will be a day to both appreciate and fear. Techno-color, gamer-controlled, distributed-parameter, real-time, drag-and-drop, three-dimensional, Web-served, GIS-based, satellite-derived, NEXRAD-based, mega-bit, multi-screen voodoo processed at the speed of light can still be just voodoo hydrology, after all.
References
Boughton, W. C. 1987. “Evaluation of Partial Areas of Watershed Runoff.” J. of Ir. and Drain. Engr. 113 (3). ASCE.
CH2M Hill. 2000. Technical Memorandum 1, “Urban Stormwater Pollutant Assessment.” Prepared for North Carolina Department of Environment and Natural Resources, Division of Water Quality.
Curtis, Ph.D., David C. 2001. Storm Sizes and Shapes in the Arid Southwest. NEXRAIN Corp.: Orangevale, CA.
Huff, F. A. 1967. “Time Distribution of Rainfall in Heavy Storms.” Water Resources Research 3(4).
Kayhanian, Masoud, Thomas M. Young, and Michael K. Stenstrom. 2005. “Limitation of Current Solids Measurement in Stormwater Runoff.” Stormwater. Forester Communications: Santa Barbara, CA.
Pitt, R. 1987. Small Storm Flow and Particulate Washoff Contributions to Outfall Discharges. Ph.D. dissertation. Department of Civil and Environmental Engineering, University of Wisconsin at Madison.
Rossmiller, R. L. 1980. The Rational Formula Revisited. Proc. Int. Symp. on Urb. Storm Runoff. University of Kentucky at Lexington, July 28–31.
Schueler, Thomas R., 1987. Controlling Urban Runoff: A Practical Manual for Planning and Designing Urban BMPs. Metropolitan Washington Council of Governments, Washington, DC.
Yen, B. C., and V. T. Chow. 1980. “Design Hyetographs for Small Drainage Structures.” ASCE J. of Hydraulics 106(HY6).
This article was originally published in Stormwater July/August 2006.


