Pollutant Export From Bioretention
In 2013, the city of Redmond, WA, completed a study that showed significant export from a bioretention cell (known as a rain garden in some regions) that was constructed with a filtration media containing 60% sand and 40% compost (60/40 mix, Herrera 2014). The export exhibited a “flushing” pattern such that effluent concentrations tended to decrease over time relative to maximum values that were measured immediately following construction of the system. However, even one year after construction, the systems were still exporting pollutants. The only parameters that were not exported from the system were dissolved zinc, total zinc, motor oil, and fecal coliform. Consequently, instead of acting as a pollutant sink, the system was acting as a source for a majority of the pollutants measured. Follow-up testing indicated the specific source of the pollutants was primarily the compost and secondarily the sand used to construct the bioretention soil mix (BSM).
The results from this study ran counter to many of the findings in major bioretention literature reviews (Davis et al. 2009, Dietz 2007, Geosyntec 2013), which tend to show significant reductions of nitrogen, phosphorus, and copper. This discrepancy can largely be explained by the fact that past studies have tended to focus on BSMs that do not contain compost. Furthermore, the flushing period that occurs during system establishment was typically not captured in these past studies. Because a BSM with a high fraction of compost is the required specification in Washington state—as it is in many jurisdictions across the country (e.g., Maryland and Massachusetts)—follow-up studies were considered imperative to further characterize this flushing and to guide the development of a BSM that does not exhibit such a high degree of pollutant export during establishment.
In 2013, the city of Redmond, WA, completed a study that showed significant export from a bioretention cell (known as a rain garden in some regions) that was constructed with a filtration media containing 60% sand and 40% compost (60/40 mix, Herrera 2014). The export exhibited a "flushing" pattern such that effluent concentrations tended to decrease over time relative to maximum values that were measured immediately following construction of the system. However, even one year after construction, the systems were still exporting pollutants. The only parameters that were not exported from the system were dissolved zinc, total zinc, motor oil, and fecal coliform. Consequently, instead of acting as a pollutant sink, the system was acting as a source for a majority of the pollutants measured. Follow-up testing indicated the specific source of the pollutants was primarily the compost and secondarily the sand used to construct the bioretention soil mix (BSM). The results from this study ran counter to many of the findings in major bioretention literature reviews (Davis et al. 2009, Dietz 2007, Geosyntec 2013), which tend to show significant reductions of nitrogen, phosphorus, and copper. This discrepancy can largely be explained by the fact that past studies have tended to focus on BSMs that do not contain compost. Furthermore, the flushing period that occurs during system establishment was typically not captured in these past studies. Because a BSM with a high fraction of compost is the required specification in Washington state—as it is in many jurisdictions across the country (e.g., Maryland and Massachusetts)—follow-up studies were considered imperative to further characterize this flushing and to guide the development of a BSM that does not exhibit such a high degree of pollutant export during establishment. [text_ad] In 2014, the city began implementing a follow-up study to evaluate the treatment performance of six new bioretention systems with grant funding from the Washington State Department of Ecology (Ecology). Four of these systems were constructed in connection with improvements to the city's Maintenance and Operations Center Decant Facility (MOC). The remaining two were constructed in connection with work on the 185th Street Extension Project. One of the bioretention systems was constructed with the same BSM (60/40 mix) that was used in the original 2013 study. The five other bioretention systems were constructed with alternative BSMs as described below. Study Sites Six bioretention systems were constructed in 2014 and are being monitored for an approximately 12-month period in connection with this study. Four of the systems are located at the city's MOC on Northeast 76th Street in Redmond, WA (Figure 1). These four systems (referred to as D1-60/40, D2 RBSM, D3-LSMV, and D4-LSW) are co-located in a block design with a shared inlet (Figure 2). Approximately 3.7 acres of the MOC drain to an existing detention vault. Water from the vault is pumped to the systems through a force main. [caption id="attachment_25751" align="alignright" width="300"]- pH
- Total suspended solids
- Particle size distribution (influent only)
- Copper, total and dissolved
- Lead, total and dissolved
- Zinc, total and dissolved
- Total phosphorus
- Orthophosphate
- Total Kjeldahl nitrogen
- Nitrate+nitrite nitrogen
- Hardness
- Dissolved organic carbon
- Major cations: Ca, Mg, Na, and K
- Major anions: SO4, Cl
- Alkalinity
- Sulfide
- Fecal coliform
- Total petroleum hydrocarbons
TSS: total suspended solids
TP: total phosphorous
DCu: dissolved copper
More red indicates higher effluent concentrations; more green indicates lower effluent concentrations.
In 2014, the city began implementing a follow-up study to evaluate the treatment performance of six new bioretention systems with grant funding from the Washington State Department of Ecology (Ecology). Four of these systems were constructed in connection with improvements to the city’s Maintenance and Operations Center Decant Facility (MOC). The remaining two were constructed in connection with work on the 185th Street Extension Project. One of the bioretention systems was constructed with the same BSM (60/40 mix) that was used in the original 2013 study. The five other bioretention systems were constructed with alternative BSMs as described below.
Study Sites
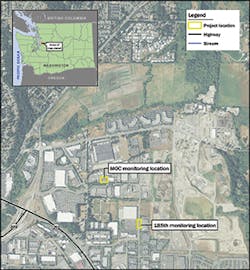
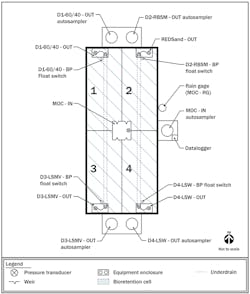
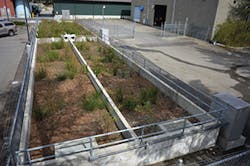
Six bioretention systems were constructed in 2014 and are being monitored for an approximately 12-month period in connection with this study. Four of the systems are located at the city’s MOC on Northeast 76th Street in Redmond, WA (Figure 1). These four systems (referred to as D1-60/40, D2 RBSM, D3-LSMV, and D4-LSW) are co-located in a block design with a shared inlet (Figure 2). Approximately 3.7 acres of the MOC drain to an existing detention vault. Water from the vault is pumped to the systems through a force main.
Each of the systems for the MOC is 10 feet wide and 57 feet in length and is constructed with concrete walls and a 40-mile high-density polyethylene (HDPE) liner along the base and walls. An 8-inch slotted underdrain pipe is placed in the center of each system in Type 26 aggregate backfill to provide drainage for stormwater that has infiltrated through an 18-inch BSM layer above (the BSM composition varies depending upon the system).
The bypass structures at the terminus of each system were designed to maintain a 12-inch maximum ponding depth in the bioretention systems. Based on continuous modelling using the Western Washington Hydrology Model (Version 3.0), the water-quality design flow rate for the MOC systems is 0.43 cubic feet per second (cfs), or 0.11 cfs (49 gallons per minute) per cell.
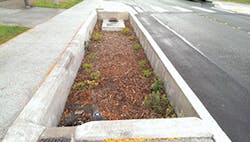
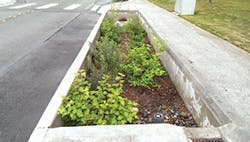
The two remaining bioretention systems are located on 185th Avenue Southeast, 200 feet north of the intersection with Northeast 68th Street (Figure 1). One system is located on the west side of the road (referred to as 185-RBSMs), and the other is located immediately across the street on the east side of the road (referred to as 185-Coir). These two systems are each 180 square feet, and each has a contributing drainage area of 10,630 square feet.
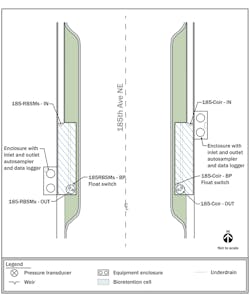
The systems on 185th Avenue Southeast were constructed using concrete vaults (Oldcastle Bio-Mod). Each system is outfitted with a slotted 6-inch underdrain pipe embedded in an 18-inch-thick Type 26 aggregate bed that is overlain by 18 inches of BSM. The underdrain pipes enter control structures that also serve as the overflow structure during large storm events. The design flow rate for each system is estimated to be 0.02 cfs, or 9 gallons per minute. Runoff enters both systems from the roadway through a grated rectangular trench on the curb line (Figure 3). Water leaving each system enters an infiltration gallery installed underneath the adjacent sidewalk on the west side of the road.
Table 1 identifies the BSMs that were used to construct each bioretention system. Photographs of all of the bioretention systems are also provided in Figure 4.
Methods
Continuous flow monitoring was conducted at influent and effluent stations that were established in each of the bioretention systems. Flow-weighted composite samples were also collected at these stations during targeted storm events in accordance with rigorous guidelines for data quality and representativeness that are identified in Ecology’s Technology Assessment Protocol-Ecology (TAPE 2011). These monitoring procedures are described in more detail below.
Influent flows entering the MOC bioretention systems were monitored with four adjustable 90-degree v notch weirs set to the same elevation (Figure 2). A stilling well equipped with a Campbell Scientific CS451 L pressure transducer was installed in the central vault that holds the influent flow prior to entry into each system. This pressure transducer was used to facilitate the accurate measurement of water levels above each of the weir crests at an influent flow-monitoring station designated MOC IN.
Effluent flows from the MOC systems were monitored at the terminus of each of the four underdrains at stations designated D1-60/40 OUT, D2-RBSM OUT, D3-LSMV OUT, and D4 LSW OUT (Figure 2). To quantify flows, each of the four outlet stations was equipped with a Campbell Scientific CS451 L pressure transducer and an 8-inch Thel Mar weir.
The pressure transducers at each monitoring station for the MOC bioretention systems were interfaced with a Campbell Scientific CR1000 data logger that was programmed to cache measurements every 10 seconds and record average water levels behind the weirs on a five-minute time step. The data logger then converted these water level readings to estimates of discharge based on standard hydraulic equations. The data logger was interfaced with a Raven XTV digital cellular modem. This communication system was configured to automatically download data and send text message alarms to field technicians and project managers.
MOC-D3 (bottom left), MOC-D4 (bottom right)
To facilitate continuous monitoring of precipitation depths, a monitoring station designated MOC RG was installed adjacent to the equipment enclosure for the Campbell Scientific CR1000 data logger described above. Precipitation depths were monitored by a Texas Electronics TE 525WS rain gauge.
Influent flows entering the 185-RBSMs and 185-Coir bioretention systems were monitored in concrete channels located along the curb lines on either side of the street (Figure 3); these stations were designated 185-RBSMs IN and 185-Coir IN. At each station, stilling wells equipped with INW PS 9805 pressure transducers were installed in association with 6-inch H-flumes to facilitate accurate measurement of influent flows to each system.
Effluent flows were monitored in the 8-inch slotted underdrain located at the southern terminus of the bioretention systems (Figure 3); these stations were designated 185-RBSMs OUT and 185-Coir OUT. To facilitate accurate measurement of effluent flows, stations 185-RBSMs OUT and 185-Coir OUT were each equipped with an INW PS 9805 pressure transducer and an 8-inch Thel Mar weir.
Separate Campbell Scientific CR1000 data loggers were also installed in association with the 185-RBSMs and 185-Coir bioretention systems and programmed to cache measurements every 10 seconds and record data on a five-minute time step. The data loggers were interfaced with Raven XTV digital cellular modems.
Precipitation depths were not monitored at the 185-RBSMs or 185-Coir bioretention systems. Instead, precipitation data for these systems were collected at the MOC RG gauge described above. This gauge is only located ⅓ of a mile away, so rainfall patterns should be very similar between the monitoring locations.
To facilitate the collection of flow-weighted composite samples, ISCO 6712 automated samplers were installed in association with the influent and effluent monitoring stations for each bioretention system. The exception was the MOC IN station, which was equipped with a Sigma 900 Max refrigerated automated sampler. Polytetrafluoroethylene (PTFE)-lined sample tubing was routed via 1.5-inch buried conduit from the automated samplers in the enclosure to the sample collection locations (Figures 2 and 3).
Each data logger was programmed to record hydrologic measurements and to trigger the automated samplers for influent and effluent monitoring stations at predefined pacing intervals during discrete storm events. Once triggered, the automated samplers collected a 220-milliliter (mL) sub-sample for compositing into separate 20-liter HDPE bottles. At least 10 of these sub-samples were collected for each targeted storm event.
Flow-weighted composite samples from each storm event were analyzed for the following suite of parameters:
- pH
- Total suspended solids
- Particle size distribution (influent only)
- Copper, total and dissolved
- Lead, total and dissolved
- Zinc, total and dissolved
- Total phosphorus
- Orthophosphate
- Total Kjeldahl nitrogen
- Nitrate+nitrite nitrogen
- Hardness
- Dissolved organic carbon
- Major cations: Ca, Mg, Na, and K
- Major anions: SO4, Cl
- Alkalinity
- Sulfide
In addition to flow-weighted composite samples, grab samples were collected and analyzed for the following:
- Fecal coliform
- Total petroleum hydrocarbons
Monitoring began in April 2014 and is currently ongoing. The 185-Coir site did not go online until June 2014 due to issues with water leakage through the floor of the vault.
Results
During the monitoring period covered by this report (April 19, 2014, to October 31, 2014), 11 paired flow-weighted composite samples were collected from the MOC (D1-60/40, D2-RBSM, D3-LSMV, D4-LSW), 10 from 185-RBSMs, and nine from 185-Coir. The original 2013 study indicated that pollutant flushing from BSMs was particularly pronounced for total suspended solids, dissolved copper, total phosphorus, and nitrate. Consequently, this article focuses on these parameters. Table 2 presents summary statistics for influent and effluent concentrations as well as percent pollutant removals for each media for this subset of parameters.
TSS: total suspended solids
TP: total phosphorous
DCu: dissolved copper
More red indicates higher effluent concentrations; more green indicates lower effluent concentrations.
As is apparent from the effluent concentrations in Table 2, the worst-performing bioretention systems contained either the 60/40 mix or the 60% sand, 15% compost, 15% biochar, 10% shredded bark mix (RBSM). Biochar was included in the RBSM mixes to specifically target copper; however, this media component did little to reduce copper concentrations while apparently contributing to increased phosphorus and nitrate export. The sandy loams performed better for total phosphorus removal, but nitrate export was still an issue. For total phosphorus, nitrate+nitrite nitrogen, and dissolved copper, the bioretention system containing sand and coir (185-Coir) had the lowest average effluent concentrations.
When considering percent removal, the overall best performer was again the 185-Coir. The performance of this bioretention system was particularly good for dissolved copper given that influent concentrations were relatively low (median = 4.3 micrograms per liter [ug/L]). Based on percent removal, the best performing systems for total phosphorus removal were the systems with loamy sands (Table 2); however, the 185-Coir system had particularly low influent concentrations of total phosphorus (median = 0.073 milligrams per liter [mg/L]), so the poor percent removal performance of the 185-Coir system may only be a function of low influent concentrations.
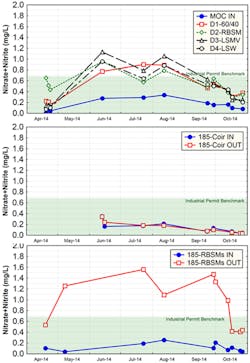
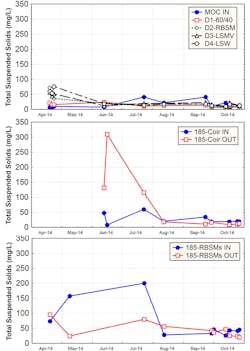
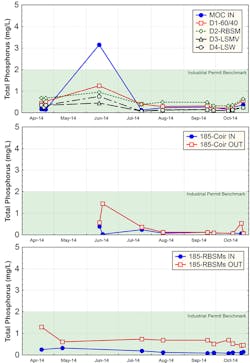
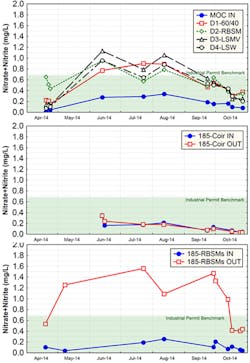
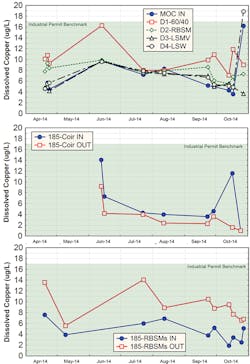
All of the concentration and percent removal values were influenced by pollutant flushing, which was apparent for all the bioretention systems. Consequently, there is a temporal aspect of the data that must be considered. Figures 5 through 8 present temporal plots for total suspended solids, total phosphorus, nitrate+nitrite nitrogen, and dissolved copper.
The most pronounced flush of total suspended solids came from the 185-Coir system (max = 310 mg/L, Figure 5). All of the systems exhibited a total suspended solids flushing except for D1-60/40, which exported relatively low concentrations for the duration of the study period.
Total phosphorus flushing was also evident for all of the systems (Figure 6). The high initial total phosphorus export from 185-Coir was associated with high total suspended solids export and is likely a function of physical export of the media. Once the total suspended solids export decreased, so did the total phosphorus export, and effluent concentrations decreased to a low value of 0.067 mg/L (the lowest of all the systems). The systems containing biochar (D2-RBSM and 185-RBSMs) and D1- 60/40 exported relatively constant and high concentrations of total phosphorus through the duration of the study (Figure 6). After four months of being online, the systems containing loamy sand (D3-LSMV and D4-LSW) began exporting relatively low concentrations of total phosphorus, outperforming all but the 185-Coir system.
Nitrate+nitrite export followed a pattern of gradual increase followed by decrease in all the systems except 185-Coir (Figure 7). This pattern is likely due to organic nitrogen mineralizing and then being exported as nitrate. The coconut (coir) and sand system (185-Coir) likely has a lower organic nitrogen content, so a similar export pattern was not observed.
A weak dissolved copper flushing pattern was observed for the systems containing the compost and biochar (D2-RBSM and 185-RBSMs). Although copper concentrations decreased with time in these systems, they were still exporting higher concentrations relative to other systems as of the last monitored storm event. Apparently, adding biochar to the sand and compost mix to control copper export was not successful. Although D1-60/40 and the loamy sand systems exported copper through the duration of the study period, they did not exhibit a strong flushing pattern. Consequently, it might be assume that it will take longer than the six-month period covered by this article to flush out the copper from the media. The 185-Coir system performed the best for copper removal. Effluent concentrations for this system were high initially at 9 ug/L; however, they decreased relatively quickly to 4 ug/L and were near 1 ug/L as of the last monitored storm event.
Conclusions
After the first six months of this one-year study, several patterns have emerged when comparing the performance of the different BSMs tested. The biochar, which was added to the sand and compost mix, apparently made the nutrient export issue worse and did not improve copper treatment. The system with the 60/40 mix (D1-60/40) and the highest percentage of compost exported the greatest amount of copper when compared with the other systems and also exported relatively high concentrations of total phosphorus and nitrate; export of these pollutants from the 60/40 mix was also observed during the original 2013 study (though at a greater magnitude). The system with sand and coir (185-Coir) initially exported high concentrations of total suspended solids, which were associated with a spike in total phosphorous; however, after approximately a two-month period, this system outperformed all of the others.
Recommendations
Both the results of the original 2013 study and the study presented in this article indicate that when compost is included in a bioretention soil media it can lead to high levels of nitrogen, phosphorus, and copper export during the first six months to a year of system operation. Many stormwater managers would find this unacceptable; consequently, it is imperative that alternate medias be identified that filter stormwater more effectively while still meeting hydraulic requirements and supporting plant growth. The sand and coir mix performed very well in terms of pollutant reduction; however, further study is required to determine if this mix, with low nutrient and organic content, will support the plants that are typically planted in bioretention systems. In addition, the sand and coir mix exhibited a high infiltration rate, which would potentially need to be slowed in order to promote pollutant removal and increase water-holding capacity.
This study highlights the need for full-scale field testing of new best management practices. As we optimize systems for construction under challenging site conditions, there can be unintended consequences to our design decisions. In this case, it was an insufficient body of literature on the water-quality performance of bioretention systems and an assumption that all BSMs will behave similarly that led to a specification (used across the country) that contributes to nutrient and copper pollution in downstream receiving waters. We recommend that compost not be used in BSMs unless the feedstock is tightly controlled and testing indicates that it will not leach nutrients and copper. Similarly, sands should be tested for nutrient and copper leaching prior to installation. Our follow-up studies have indicated that clean sand can easily be found; however, of the many composts we have tested, we have not been able to source a material that will not leach significant amounts of nitrogen, phosphorus, and copper.
Acknowledgements
This study would not have been possible without a grant from the Washington State Department of Ecology. Steve Hitch, at the city of Redmond, provided essential engineering support. Aquatic Research Inc. opened its doors on weekends and odd hours to accept samples for analysis. The authors also thank Cedar Grove Composting, Aspect Consulting, Brown and Caldwell, and Perteet Inc. for their involvement in the project.
References
Davis, A. P., W. F. Hunt, R. G. Traver, and M. Clar 2009. “Bioretention Technology: Overview of Current Practice and Future Needs.” Journal of Environmental Engineering-ASCE 135(3):109–17.
Dietz, M. 2007. “Low Impact Development Practices: A Review of Current Research and Recommendations for Future Directions.” Water, Air, & Soil Pollution 186(1):351–63.
Geosyntec Consultants 2013. Technical Memorandum: Bioretention Water Quality Treatment Performance Assessment. Prepared for Seattle Public Utilities by GeoSyntec Consultants Inc., Portland, OR.
Herrera Environmental Consultants 2014. Final Report: 185th Avenue NE Bioretention Stormwater Treatment System Performance Monitoring. Prepared for City of Redmond by Herrera Environmental Consultants Inc., Seattle, WA.
Washington State Department of Ecology. 2011. Technical Guidance for Evaluating Emerging Stormwater Treatment Technologies: Technology Assessment Protocol–Ecology (Tape). Publication No. 11-10-061, Washington State Department of Ecology, Olympia, WA.About the Author
Andy Rheaume, Douglas Howie, and Dylan Ahearn
Douglas Howie is a senior stormwater engineer with the Washington State Department of Ecology.
Dylan Ahearn, Ph.D., is an associate scientist with Herrera Environmental Consultants.
