The Value of Integrated Modeling for Predicting Bacteria and Dissolved Oxygen in Urban Streams
The city of Indianapolis is a combined sewer overflow (CSO) community with approximately 130 outfalls distributed over the following six major receiving streams: White River, Fall Creek, Pleasant Run and Bean Creek, Pogues Run, and Eagle Creek. The watersheds for each receiving stream have significant areas within and upstream of the Indianapolis combined sewer area. Figure 1 presents the Indianapolis combined sewer system area, interceptors, and treatment plants. Wastewater is treated at two locations, the Belmont and Southport Advanced Wastewater Treatment (AWT) Plants, which discharge to the White River.
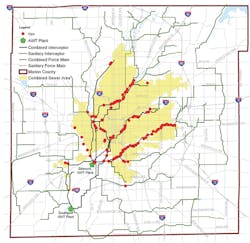
Indianapolis combined sewer outfalls and combined sewer area
As in many other riverine CSO systems, water-quality modeling was used in the development of the CSO Long Term Control Plan (LTCP) as part of the alternative evaluation and plan selection (Indianapolis 2006). Water-quality models were also used to develop the total maximum daily load (TMDL) studies for three of the five CSO receiving streams (IDEM 2004a, 2004b, 2004c), as well as to support the Stream Reach Characterization and Evaluation Report (Indianapolis 2003). Models generated supplemental data to support evaluations of existing use in the CSO receiving streams (Indianapolis 2005).
On August 26, 2011, the wastewater collection and treatment system assets were transferred from Indianapolis to Citizens Energy Group (Citizens), and CWA Authority Inc. was formed for the wastewater system. In this article, all activity relevant to the water-quality model is referred to as Citizens’ work, including work performed before August 26, 2011, by Citizens’ predecessor, the Indianapolis Department of Public Works.
The legacy water-quality models inherited by Citizens included the following:
- River hydraulic and hydrologic model in Storm Water Management Model (SWMM) 4.4g
- Water Quality Analysis Simulation Program (WASP) 5.1 EUTRO model for dissolved oxygen (DO)
- WASP 5.1 TOXI model for E. coli bacteria
- Spreadsheet post-processing tool for estimating daily bacteria loads (Indianapolis 2004)
The EUTRO model for DO included simple eutrophication to represent diurnal oxygen swings due to algal activity. This is known as a Level 4 EUTRO model (Ambrose et. al 1993) that includes ammonia, nitrate, total Kjeldahl nitrogen (TKN), phosphorus, and algae. The above water-quality models were applied to answer questions regarding in-stream flow and velocity to support recreational use, attainment of bacteria standards, and attainment of DO standards. The use of SWMM 4.4g and WASP required 25 individual model input files and 11 individual spreadsheets for a single event simulation.
As part of an initiative to reduce the number of software packages requiring long-term support by Citizens information technology group, and to streamline overall file management and labor efficiency, Citizens converted its EPA SWMM collection system hydraulic model to InfoWorks Integrated Catchment Modeling (ICM) in 2012 (Rubchinskaya et. al, 2015a). To maximize Citizens’ investment in ICM, the integration of the water-quality models began following the successful conversion of the collection system model. By having both the CSO hydraulic and water-quality model “under one roof” in the ICM database, Citizens will be able to support its long-term LTCP needs with better data integrity and efficiency (Rubchinskaya et. al 2015b).
Methodology
This section discusses the process used to integrate the water-quality models to InfoWorks ICM and recalibrate the integrated model to current in-stream data for flow, bacteria, and DO. Calibration results are discussed in the Results section.
Integration Framework. The original water-quality model was text-based and utilized three separate models that were used in sequence. The SWMM 4.4g RUNOFF model was used to develop surface runoff hydrographs from the separated sewer areas within the area of study. Runoff hydrographs output from the SWMM 4.4g RUNOFF model(s) were next input into the SWMM 4.4g EXTRAN model(s), along with the CSO flows output from the collection system model, for hydraulic flow routing of the runoff volumes through receiving surface water channels. Outputs in the form of hydrographs from the receiving water SWMM 4.4g EXTRAN model(s) were then input into the WASP 5.1 model for modeling of the water quality of the receiving waters.
The integration was performed in three phases:
- Phase 1: Flow
- Phase 2: E. coli bacteria
- Phase 3: Dissolved Oxygen
Prior to addition of the bacteria modeling parameters in InfoWorks ICM, an evaluation of InfoWorks ICM’s WQ modeling framework was conducted. The pollutant modeling capabilities of InfoWorks ICM are robust in their ability to model buildup and washoff of sediment, constituents attached to sediment, and dissolved constituents. In the case of bacteria, which is considered a “dissolved” constituent in InfoWorks ICM, bacteria is built up in “gully pots,” which represent curbs and other areas where sediment accumulates during periods of dry weather, and washed off during periods of wet weather. Each runoff subcatchment within the model can be assigned buildup and washoff parameters to simulate introduction of bacteria into the sewer system. After review of this modeling approach, it was determined that this would require the expansion of the collection system model to incorporate sediment transport. Also, while the buildup and washoff model is an effective tool for modeling the water quality within the collection system, InfoWorks ICM lacks treatment functions to account for removal of constituents from the AWT Plant outfalls and satellite CSO treatment facilities prior to discharge into the modeled rivers and streams.
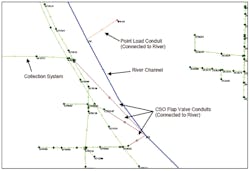
To forego using the InfoWorks ICM buildup and washoff model, a pollutograph approach was developed using two separate model scenarios used in sequence to model in-stream water quality. First, the hydraulic model of the fully integrated collection system and surface water model is run. Hydrographs from every major river or stream inflow connection including treatment plants, stormwater runoff, and CSO discharges are then extracted from the model output. Second, the extracted hydrographs and developed pollutographs are run in the in-stream water-quality model. Pollutographs are used in InfoWorks as an alternative to adding water-quality constituents to the model via the buildup and washoff approach, and are used in conjunction with inflow hydrographs. Figure 2 shows a screenshot from InfoWorks ICM model to illustrate the pollutograph approach.
Surface water withdrawals from the Fall Creek and White River drinking water treatment plants were accounted for in the model with the use of constant flow pumps from the channel nodes to dummy outfalls. Operations data obtained for the period of calibration were averaged to establish the constant withdrawal flow rates used in the model.
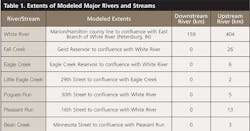
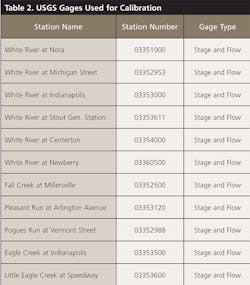
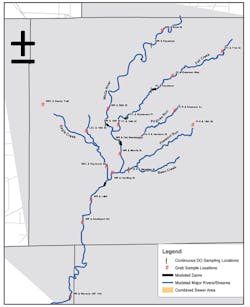
For the stream network, major rivers and streams were modeled in the EXTRAN model as conduits with channel cross section shapes in HEC2 format. The major rivers and streams that were included in the original SWMM model, and subsequently the converted InfoWorks ICM model, are listed in Table 1. It is important to note that the modeled extents of the White River extend from the Marion/Hamilton County border to the north, and the confluence with the East Branch of the White River in Knox County to the south. The remaining major rivers and stream extents were only modeled within Marion County. Figure 3 presents the extents of the White River for the integrated model, as well as other major rivers and streams modeled within Marion County.
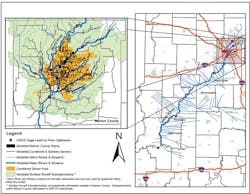
Data for Integrated Model Recalibration. Calibration of phase 1 focused on calibration of flows in the major rivers and streams at US Geological Survey (USGS) gaging stations. The USGS stations used for calibration are listed in Table 2 and shown in Figure 3.
** Rates were adjusted based on EPA documentation (USEPA 1985).
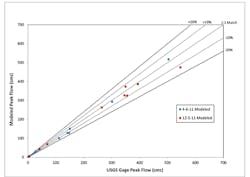
The model was calibrated and validated by comparing modeled peak river/stream flow to USGS gaged peak river/stream flow for the selected events. Calibration and validation was deemed successful if the percent difference between modeled and gaged peak flows was less than 20%.
Three events were chosen for calibration and validation of the surface water flows: one dry-weather event and two wet-weather events (one for calibration and one for validation). Detailed event screening was completed to ensure that monthly surface sampling data collected by the Citizens’ Environmental Stewardship River Monitoring Program (to be used in phase 2 and 3 calibration) were available along with full coverage of USGS stream flow data for all calibration locations. Wet-weather events were also selected to ensure that ample precipitation occurred to guarantee CSO activations.
The July 10, 2012, monthly sampling event was chosen for dry-weather flow calibration. Ten days of dry antecedent conditions with high daytime average temperatures was reflected in the observed steady-state conditions of the major surface water flows for this period. Also, this period of the summer of 2012 was categorized as a moderate drought; therefore this dry-weather event could be considered a “worst-case” dry-weather event. The April 6, 2011, and December 5, 2011, monthly sampling events were chosen for wet-weather flow calibration and validation, respectively. Both events saw greater than 12.7 millimeters (0.50 inches) of rainfall within 48 hours prior to the time of sampling. An important part of the above event selection is the objective of developing a representative calibration that can be applied to events year-round. The previous calibration of the water-quality models utilized data collected in August and September 2001 (Indianapolis 2004), which as a result tended to under-predict non-summer flows.
For the phase 2 and 3 calibrations, monthly grab sampling data were used from Citizens Environmental Stewardship Rivers Monitoring Program from locations shown in Figure 4. Grab sampling data for E. coli bacteria, DO, biochemical oxygen demand (BOD), ammonia (NH4), nitrite (NO2), nitrate (NO3), TKN, and total phosphorus (TP) were applied in calibration. In addition to monthly grab sampling data, continuous DO data from seven stations presented in Figure 4 were utilized. These stations are typically in service during the recreation season of April through October.
Integrated Model Assumptions and Constants. Citizens performed a gap analysis for the capabilities of InfoWorks ICM and the legacy water-quality model and found that for phase 1 (flow) and phase 2 (bacteria), InfoWorks has identical capabilities for the pollutographs approach. Key parameters for the integrated model in phase 1 and 2 included
- Hydrologic parameters of the storm runoff subcatchments (acreage, width, slope, and percent impervious area)
- Bacteria die-off, for which a time for 90% die-off (T90) was previously calibrated at 48 hours
- Bacteria pollutographs assuming first-flush response for CSO discharges—900,000 cfu/100 mL in the first 30 minutes, 600,000 cfu/100 mL for the next 30 minutes, then 500,000 cfu/100 mL after 60 minutes
- Bacteria pollutographs for stormwater ranging from 300 to 5,000 cfu/100 mL consistent with the TMDL studies
However, for phase 3 (DO), two significant gaps and two minor gaps were identified. The minor gaps were that InfoWorks ICM represents phosphorous as TP while WASP 5.1 represented both orthophosphate and organic phosphorous, and that ICM represents dam aeration with newer equations that have been incorporated into WASP 7 (USEPA 2006). Both of the minor gaps were addressed with data conversions during the model setup. The significant gaps included
- The WASP 5.1 calibration utilized a variable BOD decay rate based on Michaelis-Menten kinetics, while InfoWorks uses a constant decay rate. This will require the InfoWorks recalibration to focus on the best representative overall decay rate.
- Sediment oxygen demand (SOD) is only formally modeled in InfoWorks in conjunction with sediment transport. Therefore a customized process would need to be developed.
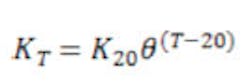
A simple user-defined process was developed to simulate sediment oxygen demand as a general DO sink. The process that was modeled is represented by the following equation:
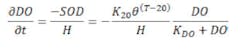
Sediment oxygen demand is defined as

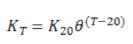
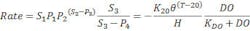
S1 – S3 are determinants and P1 – P4 are coefficients. S3 was designated as DO, and P4 was given the negative value of the dissolved oxygen half saturation coefficient (-KDO), which was taken as 0.0014 kg/m3. P2 was designated to be θ, where θ is assumed to be 1.047 (USEPA 1985). S1 and S2 are required to be determinants; therefore dummy pollutographs were entered into the model to create constant values. S1 was designated to be 1 kg/m3. Since Citizens is modeling the system with a constant temperature, the value in parentheses in the Arrhenius relationship (T-20) will be a constant. S2 was designated to be 10,000 mg/L, and P3 will be a constant value allowing us to adjust the SOD rate based on temperature if necessary. P1 will represent –K20/H. The flow depth varies throughout the model, but cannot be selected as a determinant, so a range of reasonable values within +/- 1 standard deviation of the mean depth of the streams in the model were evaluated and one was chosen to determine -1/H.
Solar radiation time series are required for algae to perform photosynthesis, not to model warming or cooling of the water. Real-time, short-wave solar radiation data were obtained from a Purdue Automated Agricultural Weather Station (PAAWS), located in Lafayette. At the time of calibration, this was the closest available data set for Indianapolis. A reflection coefficient was then applied to the data to account for the reflection of sunlight off of the water surface at different times of the day (Martin and McCutcheon 1998). These data were used to develop a generalized seasonal solar radiation time series to perform future conditions evaluations without needing event-specific solar radiation data, which would be unavailable.
Solar radiation is only used in determining the light limitation factor for algal growth. The light intensity that will produce maximum productivity is also required to determine this limitation factor, and is entered into the WQ parameters. Since algae was not formally calibrated to sampling data, the maximum light intensity from the time series was used, so that the oxygen production from photosynthesis follows the same trend seen in the continuous sampling data.
Results
This section discusses the recalibration effort to ensure that the accuracy of the integrated collection system and receiving stream water-quality model is consistent with the legacy SWMM and WASP models. The results are presented by each of the three phases in which the model integration and recalibration was performed.
Phase 1—Flow. The initial step in flow calibration was the July 10, 2012, dry-weather event. All calibrated dry-weather flow rates fall within 20% of the reliable USGS data, consistent with the level of calibration of the collection system model. Prior to beginning wet-weather flow calibration and verification for the April 6, 2011, and December 5, 2011, events, the pre/post-event baseline stream flows required adjustment to reflect antecedent moisture conditions. In terms of these two wet-weather events, the April 6, 2011, event had relatively mild and dry antecedent conditions (14 dry antecedent days), whereas the December 5, 2011, event had below-freezing conditions, followed by wet antecedent conditions (four dry antecedent days).
As with the dry-weather event calibration, operations data for the drinking water treatment plant withdrawals from Fall Creek and the White River were accounted for in the model with the use of constant flow pumps at a rate equal to the average withdrawal rate recorded for that event period. These withdrawal rates were unique to each of the two events.
Constant calibrated base inflows were run with rainfall for wet-weather calibration for the April 6, 2011, and December 5, 2011, events. Calibration of the wet-weather peak flow was accomplished by adjusting directly connected impervious area (DCIA) for the separated sewer area runoff subcatchments. Peak timing and hydrograph ascent and descent were calibrated by increasing minor stream channel lengths and/or roughness. Due to the drastically different antecedent conditions coupled with uncertainty associated with controlled reservoir releases from upstream Morse Reservoir, Geist Reservoir, Eagle Creek Reservoir, and the Pogues Run Detention Basin for this event, inflow hydrographs were used as upstream boundary conditions in the December 5, 2011, event for the White River, Fall Creek, Eagle Creek, and Pogues Run streams.
Figure 5 presents the overall calibration scatter plot for all USGS gaging stations for both wet-weather events, with peak flows presented in cubic meters per second. As shown in the figure a +/- 20% calibration was achieved.
Phase 2 – E. coli Bacteria. Calibration of bacteria began for the July 10, 2012, dry-weather event, which was assumed as a steady-state event to establish the dry-weather baseline for bacteria for wet-weather simulations. The Belmont and Southport AWT Plant effluent bacteria concentrations were adjusted to match the maximum daily effluent E. coli bacteria concentrations for the period of modeling as reported on the Monthly Report of Operations (MRO) obtained from Citizens’ Wastewater Operations. In keeping with the original model bacteria calibration, the calibration effort focused on matching the overall magnitude and trend of the bacteria concentrations along the river and stream reaches.
Modeled bacteria concentrations were compared to sampled bacteria concentrations at the specific time of sampling to ensure proper calibration during unsteady conditions. Initial model runs indicated that the sample times for this event occurred post-CSO (i.e., after the “slug” of CSO overflow volume traveled through the area of sampling), but still within the period of separated surface runoff response from tributaries. Therefore, surface runoff bacteria concentrations were assigned ranging from 300 to 7,000 cfu/100 mL. This range for individual stormwater sources is within common urban and suburban surface runoff bacteria concentrations found in literature, and is consistent with the TMDL studies for the White River, Fall Creek, and Pleasant Run (IDEM 2004a, 2004b, 2004c).
The CSO outfall pollutograph strategy from the legacy WASP model was carried over for this model calibration. Based on CSO sampling conducted during development of the original model, time-varying CSO bacteria concentrations were applied to CSO outfalls to more accurately model the commonly referred to “first flush” of pollutants from urban storm/combined sewer systems. Pollutographs at the CSO outfall links were pre-processed based on the hydrographs produced during the event hydraulic run. A bacteria concentration of 900,000 cfu/100 mL was applied to the first 30 minutes of overflow, 600,000 cfu/100 mL for the second 30 minutes, and 500,000 cfu/100 mL for the remaining overflow duration. This representation of the first-flush effect is consistent with the 2002 calibration of the legacy WASP model (Indianapolis 2004).
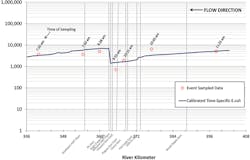
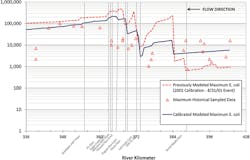
The results of the wet-weather bacteria calibration along the White River for the April 6, 2011, event are shown in Figure 6. Since both the April and December 2011 events had samples taken after the majority of the CSO pollution had exited the system, maximum modeled bacteria concentrations for the April 6, 2011, calibration event were compared to the previous water-quality modeled maximums for the August 31, 2001, event as documented in the Stream Reach Characterization and Evaluation Report (SRCER) (Indianapolis 2003). The previous WASP calibration documented in the SRCER evaluated maximum concentrations to ensure the predicted bacteria at the peak of the CSO discharge events was consistent with the largest concentrations historically sampled. As shown in Figure 7, the simulated E. coli bacteria is consistent with the historically sampled maximums, with a better overall fit against the historical sampling data than the legacy WASP model documented in the SRCER.
Phase 3 – Dissolved Oxygen. Based on the expected CSO regulatory needs of the water-quality model for dissolved oxygen and on available WERF guidance (WERF 2013), a calibration target of +/- 1.0 mg/L for DO and BOD was identified. During the initial dry-weather calibration, it was determined that the July 10, 2012, event had supersaturated DO conditions due to algal activity. While this condition is interesting, it would not allow for an appropriate baseline for spring and summer wet-weather events. For this reason, the pre-event conditions for the April 6, 2011, wet-weather event were utilized for dry-weather calibration.
Modeled WQ constituent concentrations were compared to grab and continuous sample concentrations at the specific time of sampling to ensure proper calibration during unsteady conditions. Initial model runs indicated that the grab sample times for this event occurred post-CSO (i.e., after the “slug” of CSO overflow volume traveled through the area of sampling), but still within the period of separated surface runoff response from tributaries. DO and BOD were considered calibrated when the modeled concentrations and grab sample concentrations corresponded to within 1 mg/L and the event minimum DO concentration for continuous sample data was within 1 mg/L of the modeled concentration. Ammonia, nitrite, nitrate, TKN, and total phosphorus were also compared with grab sample values to ensure that modeled values were within a reasonable range of the grab sample data, but these constituents were not calibrated to within specific levels. However, while there was not a formal calibration process for ammonia, the correlation of simulated ammonia was within 1 mg/L with available sampling data from the April and December calibration events.
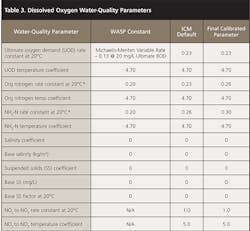
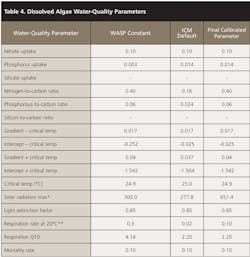
A comparison was made between the ICM default rate constants and the converted WASP rate constants used in the previous model. The WASP rate constants were used as the ICM default constants, unless the ICM rate constants and WASP constants varied greatly. Rate constants were also increased or decreased during calibration. As previously described, only the maximum solar radiation value would need to be adjusted for each individual event model run. Tables 3 and 4 summarize the WASP constants, ICM constants, and the constants that were used. Generally, the WASP constants were used as defaults, but the ICM defaults were used when the WASP constants and ICM defaults varied significantly. Several parameters were adjusted during the calibration process. EPA documentation (USEPA 1985) was used as further guidance in adjusting water-quality parameters during calibration.
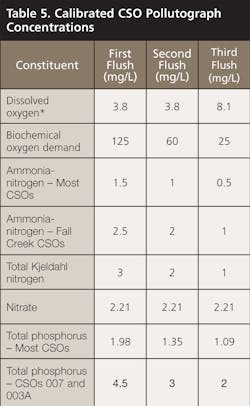
Based on CSO sampling conducted during development of the original model, time-varying CSO concentrations were applied to CSO outfalls to more accurately model the first flush of pollutants. Pollutographs at the CSO outfalls were pre-processed based on the hydrographs produced during the event hydraulic run. A first-flush concentration was applied to the first 30 minutes of overflow, a second-flush concentration for the second 30 minutes, and a third-flush concentration for the remaining overflow duration. Table 5 summarizes the various CSO discharge concentrations for each constituent. This representation of the first-flush effect is consistent with the calibration of the legacy WASP model.
Dissolved oxygen CSO pollutographs were treated differently. DO grab sample concentration data from CSO 155 in Citizens’ system and composite CSO discharge concentration data from Chicago Metropolitan Water Reclamation District of Greater Chicago (MWRDGC) were reviewed to develop the CSO pollutograph for DO. It was determined that varying the CSO DO concentrations based on the DO saturation of the model temperature would give the best results. The first and second flushes were treated as 35% of saturation, and the third flush as 75% of saturation. Concentrations for BOD at CSOs in the previous WASP model were highly variable and based on outfall sampling performed in the late 1990s and early 2000s. Due to a lack of CSO-specific sampling available for the 2011 wet-weather events at a similar resolution, a single set of pollutograph concentrations for BOD was developed based on previously sampled data.
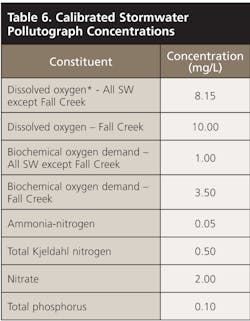
Pollutographs were also applied to inflow locations representing stormwater (SW) or minor stream flow into receiving streams. Table 6 summarizes the various SW concentrations for each constituent.
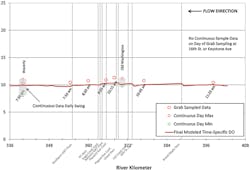
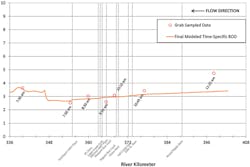
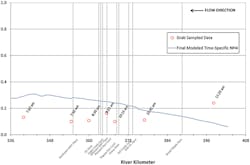
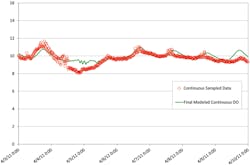
The results of the wet-weather DO, BOD, and ammonia calibration along the White River for the April 6, 2011, event are shown in Figures 8, 9, and 10. All concentrations are shown in mg/L. While Figure 8 presents instantaneous DO concentrations at the time of sampling along the river profile, Figure 11 presents the simulated DO against the continuous DO data collected at the Waverly station south of the Indianapolis combined sewer system. All four figures show the model has been adequately calibrated to its objectives.
The calibrated water-quality parameters and rate constants from the April 6, 2011, event were carried over to run with the December 5, 2011, hydraulic conditions for wet-weather validation. The water temperature was adjusted to 7°C (44.6°F) and the P3 coefficient for SOD was adjusted to 23 to reflect the temperature change. A solar radiation time series was created for the December 5, 2011, event in the same manner that it was created for the April 6, 2011, event, and the maximum production solar radiation value in the water-quality parameters was changed to the maximum value from the time series, 230 W/m2. All inflows from point loads, minor streams, and headwaters were adjusted to match observed instream concentrations with modeled concentrations.
Similar to the April 6, 2011, event, sampling conducted within Marion County for this event occurred post-CSO discharge. However, the model shows traces of the tail end of CSO flows pushing through the White River downstream of the Southport Road sampling location, including the Waverly sampling point, at the time of sampling. Given the large river flow rates for this event, the trailing CSO effects were negligible in the model results.
Calibration Summary. For the three 2011 and 2012 events utilized in calibration, an overall calibration accuracy of +/- 20% for flow, consistency with recent and historical sampling data for E. coli bacteria, and +/- 1 mg/L for DO, BOD, and ammonia nitrogen have been achieved. It should be noted that the observed fit for ammonia nitrogen was not the result of a formal calibration for ammonia and nitrate, but a byproduct of calibration for DO and BOD.
Model Limitations. This section discusses a few limitations of the integrated modeling approach observed by Citizens as the model calibration was completed. These limitations will be taken into consideration during future model applications and should be taken into consideration by other utilities contemplating integrated collection system and receiving-water-quality modeling:
- Out-of-County Rainfall. The National Climactic Data Center provides access to hourly rainfall data for dozens of locations of interest within the area of study. However, hourly precipitation data are too coarse, and will not accurately account for peaks in rainfall intensity throughout an event. Currently, in the model, rainfall time series from within Marion County are extrapolated north and south of the county. Access to five-minute rainfall data for various out-of-county locations within the area of study will greatly reduce the uncertainty associated with extrapolated rainfall.
- 2D River Hydraulics. More detailed hydraulic analysis of the surface water systems along with their interaction with the collection system could be completed with further updates to the model. By converting the current surface water channels to river reaches within the model, a 2D mesh can be created of the rivers and banks. This would allow for detailed 2D analysis of the stream/river hydraulics to assess overall surface flooding and/or backups into the collection system. Calibration of the model to surface water stage to complement the completed flow calibration would be required for such an update.
- DO Under-Prediction During Low Flows. Since re-aeration is calculated in ICM solely as a function of stream velocity, InfoWorks can under-predict DO on smaller streams (such as Pleasant Run) just upstream of their confluence with larger receiving streams (White River), since velocities will decrease and depths will increase on the smaller streams due to water backing up from the larger receiving streams during rain events. In these cases, data for the furthest downstream end of a minor stream should be taken from the corresponding location on the receiving stream. Future updates to ICM may allow for improved methods of re-aeration calculation, or more specific control of re-aeration rate constants based on location.
- Temperature Assumptions. The temperature and time of year to be modeled when performing WQ simulations should be considered carefully for DO and BOD modeling efforts. Modeling efforts in the future with temperatures or solar radiation conditions that vary from previous simulations will need to adjust the solar radiation, water temperature, SOD parameters, and inflow DO concentrations, and possibly inflow nutrient concentrations.
Summary and Conclusions
Citizens Energy Group has completed the integration of its collection system and water-quality models into InfoWorks ICM. The models have been successfully recalibrated to equal or better accuracy than the legacy models utilized to support Citizens’ regulatory program. Citizens now has the ability to apply its integrated model to support any potential updates to NPDES permit effluent limits, revisions to the TMDL studies, the development of a Use Attainability Analysis, or evaluations of current or future conditions against the Indiana daily maximum standards or federal recreational water-quality criteria (USEPA 2012). The models may also be incorporated into post-construction monitoring (PCM) of LTCP projects, although water-quality modeling is not a formal requirement of the PCM program (Indianapolis 2006).
The completion of the integrated modeling framework allows Citizens to proceed in confidence knowing that the water-quality model representation is housed in the same database as the collection system model and cannot be lost or forgotten.
Since completion of the calibration in 2014, the following applications of the integrated model have been performed or are in progress:
- Evaluations of the sensitivity of in-stream DO and ammonia to DO discharged in AWT effluent, in anticipation of the next NPDES permit renewal. A one-year design storm under 7Q10 flow conditions was evaluated.
- Evaluations of the attainment of federal recreational water-quality criteria following completion of the CSO consent decree as part of Citizens’ overall regulatory approach (Hawbaker et. al, 2016). The 1996–2000 representative precipitation period identified in the LTCP (Indianapolis 2006) was applied as a continuous simulation for E. coli bacteria.
- Evaluations of impacts for E. coli bacteria in tributary streams for flow augmentation scenarios.
References
Ambrose, B., T. Wool, and J. Martin. 1993. The Water Quality Analysis Simulation Program, WASP5 Part B: The WASP5 Input Dataset.
Hawbaker, O., R. Schaefer, and K. Comer. 2016. Compliance Strategies for Your CSO Long Term Control Program: A Case Study of the Citizens Energy Group (Indianapolis, IN) Approach. Water Environment Federation Collection Systems Specialty Conference 2016, Atlanta, GA.
Indiana Department of Environmental Management. 2004a. Fall Creek Total Maximum Daily Load Report.
Indiana Department of Environmental Management. 2004b. Pleasant Run and Bean Creek Total Maximum Daily Load Report.
Indiana Department of Environmental Management. 2004c. White River Total Maximum Daily Load Report.
Indianapolis DPW. 2004. Indianapolis Combined Sewer Overflow Long Term Control Plan Hydraulic and Water Quality Modeling Report.
Indianapolis DPW. 2005. Information to Support an Existing Use Determination for CSO-Impacted Portions of Marion County Streams.
Indianapolis DPW. 2006. Raw Sewage Overflow Long-Term Control Plan and Water Quality Improvement Report.
Indianapolis DPW. 2003. Stream Reach Characterization and Evaluation Report.
Martin, J., and S. McCutcheon. 1998. Hydrodynamics and Transport for Water Quality Modeling.
Rubchinskaya, C., D. Sutton, C. Ranck, and S. Rowe. 2015a. “Model Meets World: Guiding and Evolving Integrated Model.” Water Environment Federation Technical Exhibition and Conference (WEFTEC) 2015, Chicago, IL.
Rubchinskaya, C., C. Ranck, S. Berry, C. Hathaway, and D. Markowitz. 2015b. “The Value of Integrated Modeling for Predicting Bacteria and Dissolved Oxygen in Urban Streams.” Water Environment Federation Technical Exhibition and Conference (WEFTEC) 2015, Chicago, IL.
US Environmental Protection Agency (EPA). 2012. 2012 Recreational Water Quality Criteria Fact Sheet.
USEPA. 1985. Constants and Kinetics Formulations in Surface Water Quality Modeling.
USEPA. 2006. Processes and Equations Implemented in WASP7 Eutrophication Module.
Water Environment Research Federation. 2013. Modeling Guidance for Developing Site-Specific Nutrient Goals.