Calgary is situated at the confluence of Bow and Elbow River about 80 kilometers (50 miles) east of the Front Ranges of the Canadian Rockies. With a population of 1.27 million, Calgary is Canada’s third-largest municipality and fourth-largest Canadian census metropolitan area. Calgary encompasses six watersheds: Nose Creek, Elbow River, Fish Creek, Pine Creek, Western Irrigation Canal, and Bow River. The majority of the city area, except for a small portion of irrigation canal area, eventually drains into Bow River. Bow River is a world-famous river for fly fishing brown and rainbow trout. To protect fish in Bow River, Alberta Environment and Parks (AEP) has set total suspended solids (TSS) and total phosphorous (TP) loading objectives for Calgary. To ensure the City meets the AEP TSS objective and as part of the Stormwater Management Strategy, the City has committed to keeping TSS loadings to the Bow River at the 2005 level, in spite of ongoing population growth and city development.
In order to provide technical support for the Stormwater Management Strategy update and ensure the City is continuously meeting the AEP objectives, Tetra Tech was retained and conducted a “City-wide Stormwater Loading Targets Development” study in 2015. A city-wide stormwater model was developed using a SWMM-SUSTAIN framework. The model was also applied to evaluate future 2028 and 2078 scenarios considering new-development and redevelopment conditions.
Setting Up the Model
Due to its location near the Rocky Mountain Foothills, Calgary’s rainfalls are localized. More than 30 rain gauges within the city area have been installed since the 1980s to monitor rainfall from May to September. To save computational time, the city area is divided into seven rain zones. The Thiessen polygon method was used to generate seven rain zone time series from the City’s 32 rain gauges and Calgary airport data. For other weather data such as wind speed, airport data were used.
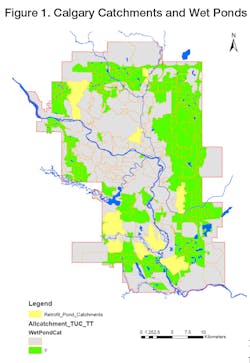
The System for Urban Stormwater Treatment and Analysis Integration (SUSTAIN) model contains the catchments and pond routing network and summarizes the runoff and loading for a catchment or outfall. The City’s stormwater catchments and wet ponds are shown in Figure 1. A total of 471 catchments and 178 wet ponds and wetlands were configured in the SUSTAIN model. When routing through the wet ponds, TSS was distributed to sand, silt, and clay with different settling velocities; first-order decay was used for inorganic and organic phosphorus to represent the removal of TP.
Event Mean Concentrations were applied for winter TSS representation instead of buildup and wash off, since winter TSS load in Calgary is mainly driven by winter sanding.
Stormwater Monitoring and Model Calibration
The City has been monitoring its stormwater flow and quality since 2001. The water quality of baseflow, rain, and snowmelt events for residential, commercial, industrial land uses were monitored at 16 locations from 2001 to 2005. Since 2015, the flow- and event-based water quality data have been collected year-round at land use catchment outlets, outfalls, and wet pond inlets/outlets to better understand the stormwater flow and quality.
Fourteen monitoring sites were used to calibrate the hydrology and eight sites to calibrate TSS and TP loadings.
For hydrology calibration, infiltration parameters and depression storage were adjusted iteratively until model results agreed well with monitoring data. The hydrology calibration errors for 14 sites were within -26% and +28% with an overall relative error of less than 1.0%.
For TSS calibration, the buildup rates, in order from high to low, are gravel surface, industrial, transportation, high-density residential, commercial, low-density residential, and other land surfaces.
The wash-off parameters were set to be identical for all the HRUs with the assumption that the sameThe buildup rate, from high to low, for organic and inorganic phosphorus are listed in Table 1.
The first-order decay rates for organic and inorganic through wet ponds were also calibrated. The TP calibration errors at eight sites were within -9% to +49% with an overall relative error of 0.2%.
The City-Wide Model
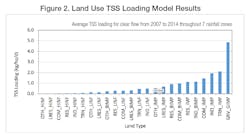
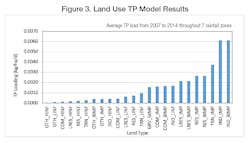
The parameters from calibration were applied to the city-wide model. To be conservative, all impervious area was treated as effective imperviousness. HRU TSS and TP simulated loading results are shown in Figures 2 and 3.
Calgary experienced rapid growth from 2006 to 2014 as a result of the oil industry boom. The growth rate peaked in 2014, as did construction. The construction loading calculation was based on 2014 conditions, which is conservative.
Daily TSS loadings from the construction sites were calculated using an estimated average annual construction site TSS yield—2 tons per hectare per year with a downstream pond removal rate of 65% and a green space removal rate of 60%. The annual average TSS yield was distributed to daily TSS loadings based on daily precipitation data. The TSS loading from construction sites was added to the SWMM-SUSTAIN model results as a post-processing step. The average daily TSS loadings from construction sites were calculated as 5,427 kilograms (12,000 pounds) per day.
Future ScenariosThe timeline for the next renewal of provincial approval is 2028. The City’s long-term planning scenario is for 2078, which aligns with the City’s Municipal Development Plan. The new development area information was obtained from the City Planning Division. For the redevelopment, it was assumed all inner-city areas will be redeveloped by 2078, and one-sixth of the inner-city will be redeveloped by 2028. It was assumed that redevelopment imperviousness percentage will increase from the current 50% to 70% for residential and 85% for commercial.
With current Calgary’s stormwater policy, Nose Creek, West Nose Creek, and Pine Creek have runoff volume control targets. For other watersheds, wet ponds are required to attenuate 100-year floods in Calgary’s Stormwater Design Manual. With most newly designed wet ponds, TSS removal efficiency could reach 90%. To be conservative, it is assumed that future wet ponds will remove 80% of TSS.
It was assumed that stormwater ponds will reduce 40% of TP and the volume control measures will reduce 50% of TP for future scenarios; the construction loading will be the same as the 2014 level.
Project Findings
More than half of the City’s future greenfield development is in Nose Creek, Pine Creek, and West Nose Creek where volume control targets are already in place. The Bow River direct watershed has 36% of greenfield development where the wet ponds (but no assumed volume control) were applied for future scenarios.
This study showed that the average wet pond treatment efficiencies within the City are 81% for TSS and 58% for TP. Newer ponds have higher TSS removal efficiencies as a result of better pond design. Usually, the volume control approach adds 5 to 8% higher efficiency for TSS removal compared with wet pond treatment alone.
With stormwater retrofit ponds and current stormwater management policies (e.g., Interim Stormwater targets requirement), the annual stormwater TSS loading increase has been reduced from 112 kg/day (247 lbs/day) (as shown in Golder’s 2007 modeling results) to 56 kg/day (123 lbs/day) for the present condition during the clear flow period.Based on present controls and the addition of three retrofit ponds (Bowmont East pond was completed in 2017, Ogden and Highfield ponds are scheduled for construction), the modeling results showed that the City will continue to meet the TSS Council commitment of 41,000 kg/day (90,000 lbs/day) beyond 2028 and is projected to only slightly exceed the TSS Council commitment 58 years from now, in 2078.
Modeling results showed gravel surfaces (gravel lanes and parking lots) and construction sites are disproportionately high TSS contributors. Gravel surfaces were estimated to contribute 22% of TSS loading to the Bow River from only 3% of the city’s area. Construction sites contribute 13% of TSS loading from only 4% of the area. Together, a total of 35% of all TSS is being generated by only 7% of the City’s land area.
Model runs showed that if gravel surfaces are eliminated in new development and redevelopment in the near future, the TSS loading would remain below the Council commitment beyond 2078.
Watershed-Level TSS Control Targets
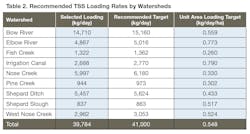
To better manage the TSS load entering the Bow River, Tetra Tech recommended that the City manage the TSS loading rates by watersheds. Different watersheds have different drainage areas, land uses, soil types, impervious covers, and future developments, resulting in different contributions of TSS from different watersheds under current and future conditions. The recommended targets were based on the loading rates from the watersheds in scenario 2028 and scenario 2078 without gravel lane and the council commitment of 41,000 kg/day. The recommended TSS loading targets by watersheds are listed in Table 3.
Recommendations
The study and modeling resulted in the following recommendations to the city:
- For redevelopment areas without any stormwater treatment, to improve stormwater quality and better maintain pipe capacity, investigate alternatives to erodible gravel surfaces and apply source/volume control measures to achieve TSS loading reduction.
- For new development, investigate alternatives to erodible gravel surfaces based on Triple Bottom Line analysis including life cycle cost.
- A new study—Gravel Lane Sediment Abatement Study—was initiated last year as a result of the above recommendations. The study is using the TBL approach to evaluate gravel lane, paved lane, and alternatives. Three alternatives will be chosen as pilot projects.
- Investigate opportunities to further reduce construction site TSS loadings, through enhanced Sediment Erosion Control measures, refining standards for sedimentation pond performance during construction periods, assessing enforcement and incentive techniques, developing a policy for stripping and grading practices or related measures.
- Work with Roads to optimize winter salting and sanding operations to further reduce TSS loading and other environmental impacts.
Resources
Golder Associates. “Bow River Impact Study – Phase 2: Development of total Loading Management Targets for The City of Calgary.” 2007.
About the Author
Stacey Zhao
Stacey Zhao is a water resources engineer for the City of Calgary with more than 20 years of experience in river and stormwater quality monitoring and modeling, watershed and stormwater management, and planning and project management.
Sen Bai
Dr. Sen Bai is a senior environmental engineer/modeler with Tetra Tech out of Fairfax, VA. He has more than 20 years of experience performing and leading projects involving watershed modeling, stormwater modeling, and receiving water modeling to support TMDL, watershed management, and stormwater management to EPA, state, and municipal clients.


