Certainly those needs are far-reaching. From modernizing aging infrastructure, to energy efficiency and loss prevention, the demands have led the industry to an approach that looks at distribution and treatment as a function of total water resource management. And within that framework, the most efficient solutions are changing the way the industry operates.
Flow Rates Versus Energy Savings
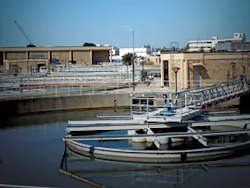
The issues of aging infrastructure still dominate the landscape, and posed a critical problem for the city of Indianapolis, IN, when it acquired Indianapolis Water from private operator, NiSource, in 2002. The answer to their problem came in the form of a private public partnership with Veolia Water North America, based in Chicago, IL. Veolia provides water and wastewater services to municipal and industrial customers, and serves more than 14 million people in approximately 600 communities in the US. For Indianapolis Water, the company manages all operations, maintenance, and customer service, with water and sewer service provided to approximately 1.1 million people throughout nine counties in central Indiana. Facilities include four surface water treatment plants with daily water production, averaging 138 million gallons of water per day (MGD) and peak demand capacity in excess of 200 MGD.

New options for monitoring and control are enabling greater efficiency gains.
A Computer Control System (CCS) runs the distribution system and all storage tanks plus monitoring of reservoir elevations. Nonetheless, the older facilities, equipment, and pipelines have many problems, according to Dan Moran, senior process engineer in the Indianapolis technical direction group. “The issue with a lot of water treatment facilities, in general, is they’ve been around for a long time and designed for focusing on the actual flow rates on the production side with not as much of a focus on energy savings. So there’s more opportunity there for energy efficiency and changes such as rightsizing pumps.”
In the past, utilities looking at upgrades and capital planning traditionally made decisions based on a design and capital cost model, but a total resource approach has to take other factors into consideration. “We look at it as the triple bottom line approach,” says Moran. “We’re looking at the financial side, sustainability, and the social impact of capital projects. So a project might be a little more expensive, but if it has more sustainability benefits it can be a more desirable option. Then there’s the social impact, or how a project affects the community. That one can be a little bit more difficult to quantify in a numbers way, but it could be related to rates, or to other factors that might be advantageous, or in opposition to the local community.”
Veolia’s agreement with the city called for a performance-based operating agreement, and the company began by addressing the utility’s needs with a more systematic methodology for managing water quality production and assets. According to Moran, one major step to accomplishing their goals was achieved when Indianapolis became the only major US city now certified in ISO 9001 and 14001 (ISO 9001 and 14001 represent internationally recognized standards that incorporate quality management principles and practices.
Five-Year Rate Freeze
The certification has provided better documentation and repeatability between different operators to ensure that best practices are followed. The ISO procedures also help with training. “In the past, training of new operators was half technical and half art,” says Moran. “Now we have made that a smoother transition with the standardization process. When new operators come, they can get up to speed faster and have more confidence in running the facility.”
Overall results of the program include a five-year freeze on rates that avoided a 30% increase planned by the previous management. Complaints about taste and odor fell from
501 in 2001, to less than 10 in 2008.
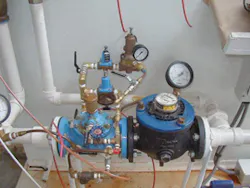
Energy efficiency and sustainability have been priorities for Veolia. For example, the system’s Riverside, CA, pump station was a historic landmark that originally housed steam driven pumps, but its design and equipment were a major source of energy waste. Veolia evaluated energy consumption and installed a variable frequency drive (VFD) on the station’s 1,250-horsepower (hp) pump. The station has several smaller pumps, some with high-speed and others with low-speed motors, that were previously operated in combinations to achieve various discharge flow rates. The VFD installation allows the fixed-speed pumps run as the baseload of the station, with the VFD pump adjusting to maintain proper flow rates. The new design reduced high-pressure fluctuation in the distribution system caused by switching from high-speed to low-speed pumps.
Total cost of the upgrade was $250,000, and the installation supplements the building’s heating demand by taking advantage of the heat generated by the VFD. The extra heat lightened the building’s heating load and saves about $2,000 to $4,000 per month in the winter. Total savings from 2008 were roughly $150,000, so the project paid for itself in less than two years.
DOE Pushes Pumps
Energy savings from pumps are a high priority for the US Department of Energy’s (DOE) Best Practices Program. The DOE offers a software program called the Pump System Assessment Tool, and it identifies energy efficiency opportunities.
In a recent EPA Motor Challenge Showcase Demonstration project, the software helped the town of Trumbull achieve a 44% savings at a sewage pump station, simply by adding 10-hp pump to relieve an inefficient system. Although the solution looks like a simple step, the analysis required something a bit deeper. A systems approach that examined total system performance revealed that two pumps in the original design operated well below optimum efficiency. Moreover, the station required the constant operation of two circulating cooling water pumps and continuously running compressors.
The new 10-hp pump handles the same volume as the original pumps during non-peak times, and relieves stress on the rest of the system, so engineers could remove the compressors and circulation pumps. The project cost amounted to $12,000, with annual energy cost savings of $2,614, for a simple payback of 4.6 years. Annual energy savings hit 31,875 kWh.
State agencies such as the New York State Energy Research and Development Authority (NYSERDA) are taking a similar approach to the DOE’s efforts to help utilities manage their resources for efficient energy use. For example, NYSERDA Monroe County Water Authority (MCWA), the third largest water provider in New York State, has a water delivery system comprised of more than 2,100 miles of water mains and storage capabilities of up to 150 million gallons. The storage capacity helps to reduce energy use, but MCWA still found it was paying high rates for peak energy use and enrolled in NYSERDA’s New York Energy $martSM Peak-Load Reduction Program.
An assessment of MCWA’s operations by an independent consultant identified opportunities to improve curtailment, and NYSERDA provided an $85,000 incentive to carry out
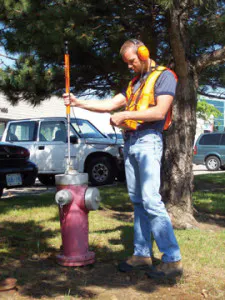
A water audit using modern technologies is the first step towards accurate data collection.
the installation of real-time meters at each pump location to determine energy usage and verify actual reduction during an energy curtailment. Next, MCWA integrated the meters with the management system to analyze water reserves and ensure the availability of proper water supplies, even during a curtailment. The savings allow MCWA to participate in the New York Independent System Operator’s Special Cases Resource Program, and MCWA has committed 8,000 kW of its average monthly demand peak of 13,000 kW to the program.
Advanced Metering Infrastructure Changes Everything
Real-time metering is moving beyond pumps and driving something of a revolution in the field of water distribution, according to David M. Hughes, lead infrastructure engineer for American Water. American Water is the largest investor-owned US water and wastewater utility company, serving approximately 16 million people in 35 states, as well as Ontario and Manitoba, Canada. At the West Virginia American Water operation, a $3.85-million grant from the American Recovery and Reinvestment Act helped launch an EPA-approved “green” project involving the installation of an Advanced Metering Infrastructure (AMI) system. It’s a pilot project serving approximately 12,000 customers in Fayette County, WV, and, if successful, it could be expanded throughout West Virginia American Water’s service territory.
The AMI system collects water consumption data at customer meters and transmits it to the company’s computer network daily via radio frequency. Employees evaluate the data for billing purposes, and more importantly, to uncover irregularities such as a water leaks. Quicker notification reduces water losses and property damage.
“In the past, a system that had leaks would hire a company, or, if they have enough staff, they would send somebody in the middle of the night with listening devices to find leaks, and that might happen once a year, but more typically it was once every three or five years,” says Hughes. “Now we’re looking at things as they change day-to-day, so it’s quite an improvement.” The system also detects leaks along the utility’s water mains through the use of acoustic monitors. Finding those leaks before they surface saves water and reduces damage caused by erosion, and the resulting water conservation reduces energy consumption.
Industry leaders see AMI as the platform of the future.
Spotting Excessive Water Use
“With the automatic meter reading and advanced metering infrastructure we’re getting reports and meter readings every day, and that’s another set of data management that we can use to help spot customers with excessive use,” adds Hughes. “With the smart meters, we have the ability to collect readings as short as every 15 minutes. So it’s possible to employ an intelligent reader that also analyzes the data. In a situation such as a meter running backwards, the system could flag the problem for attention.”
Another benefit coming to light is the reduction of injuries, and that’s important, according to Stephen P. Schmitt, P.E., vice president of Operations Services with American Water. “Meter readers, as a group, have some of the highest injury rates,” says Schmitt. “They tend to be non-serious events such as slips and falls over even poison ivy while gaining access to meters.” Overall, American Water has seen a decline in injury rates with the use of AMI technology, and a further decline in general liability claims from accidents blamed on meters mounted in sidewalk meter pits.
With such benefits, it’s not surprising that industry leaders—such as John Bigelow, president, New Jersey American Water—see AMI technology as the platform for the future. “From my perspective, the value of a fixed-base system comes with the other things we can accomplish,” says Bigelow. “Besides getting a meter reading for billing, the most obvious will be linking the technology so that when a customer calls with a billing issue, the service rep can go online and look at the meter at that moment and tell a customer to shut off all their water faucets or water using appliances, and then see if the meter is still detecting usage. We can instantaneously tell a customer by tracking usage during the night whether their residence has a leak. In this scenario, the meter is always communicating with the utility.”
Opportunities for new forms of information from the meters are coming, adds Bigelow. “Right now we send people into the streets every day to check the water quality of our
Pressure management and leak detection can speed up the identification of needed repairs.
customers. But there’s no reason we couldn’t have automated monitors within the system. Once you have the platform, other things will be developed and we can improve security, water quality, and drive down our costs. So for me, the real value is in building the platform methodology so that can gather information that we can actually use.”
Large commercial customers and institutions such as universities won’t miss out on the benefits either. American Water serves a steel plant in St. Louis, MO, that needs to maintain detailed water usage data because their bills are enormous and the potential for waste is significant. “This is a situation where, a few years ago, we set up telemetry to look at the site’s water use, but with an AMI system, it’s even easier to analyze the situation,” says Schmitt. “It could be the same for a college campus or apartment complex to keep them better informed, and there are a few systems now that can provide customers with access to water usage through the Internet. We’re seeing that vendors are starting to get the message now and building more sophisticated data management systems that will help us along.”
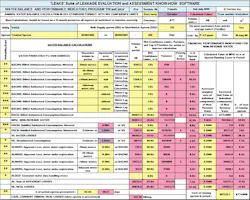
Underestimated Losses and “Make Believe” Numbers
One such vendor is Veritec USA, Sacramento, CA, and, according to Paul Fanner, principal, utilities in North America are losing much more water than their estimates show, due to a lack of consistency in quantifying losses and a further lack in reporting requirements. “With no audit process to go back and verify the numbers, utilities in North America have largely been underestimating their losses,” says Fanner. “And in a lot of cases, these utilities have been reporting these numbers for so long that they tend to get believed.”
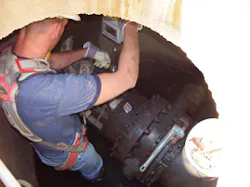
The starting point in reversing this trend of make believe numbers begins with a water audit, using modern methodologies that can validate the numbers, and the equipment’s ability to report accurate statistics. Fanner notes, “It’s surprising how few utilities actually do any testing of their input meters, and a lot of utilities don’t meter all the water they produce. These are big units often installed and built at the time the system was developed, and they need to be checked as they age. They should be checked every year, but it’s rarely done, and the technology deteriorates over time so you have problems like corrosion within the water flow path.”
Not surprisingly, the process typically reveals some disappointing information about the actual losses a utility is incurring, but the good news is that there are some effective strategies for recovering lost revenue and avoiding future expenditures. “Once you’ve done the validation and know what you’re losing, you can develop a loss reduction strategy for your system,” says Fanner. “Virtually every utility in North America is below the economic level they’d like to be at, so doing this actually pays to reduce losses.”
Operators of the Regional Municipality of York, in Newmarket, Ontario, Canada, were surprised at the outcome after completing their audit. According to Theresa MacIntyre-Morris, York’s water efficiency and conservation co-coordinator, the goal was to recover losses estimated at 5.6 million liters per day (MLD), but the actual savings exceeded 7.65 MLD. The project ran from 1998 to 2006, and involved the design and implementation of 65 temporary district metered areas, testing and leak detection, and ultimately, the design and construction of 10 permanent pressure management areas to determine water savings associated with the control of background leakage.
Pressure As a Balancing Tool
Pressure management is becoming a high priority in water systems, notes Fanner. “Of course, there’s a lot of resistance to reducing water pressure because high pressure is desirable for firefighting, and customers are happy when they see high pressure coming out of their faucets. But high pressure aggravates leakage, so if you can optimize your pressures in the system, it reduces the volume of leaks coming from all the breaks and background lost in the system. It also reduces the number of new breaks that will occur, becomes very cost-effective, and can extend the life of your infrastructure.”
Many utilities are taking advantage of the improvements in SCADA systems.
There are two sides to the approach. One is controlling excess pressure 24 hours a day, but a lot of pressure management methods focus on reducing the night pressure. Because customers don’t use as much water at night, that causes pressures to rise and stress the system. “If you can reduce night pressure, it will help,” says Fanner. “Most breaks at water mains happen at night. Even if you don’t want a reduced day pressure you can reduce night pressure, so it is equal to day pressure, and you’re going to get significant savings.”
As the benefits of pressure management and leak detection speed up, the identification of candidates for repairs, carrying out those repairs efficiently, and keeping accurate records becomes equally important, says Allen Rape, GIS manager at Henry County (GA) Water & Sewerage Authority.
“Before we started using GIS, we were your typical old-school business, and everything was kept on paper and spreadsheets, and files and log books,” recalls Rape. “We didn’t have anything electronically, other than some files we developed for some of the water system, so we were starting from the ground up. We’re still building it, and it’s a never-ending process.”
Today, Henry County has migrated to the “electronic age,” and data is utilized to make capital improvement decisions much more efficient. Employees can consult a GIS Web map and post maps to the authority’s intranet, so every employee can see the data needed for their purpose. “It’s wonderful,” says Rape. “If we click on a pipe, it will connect to our project management database, so we have the data from the start of its build to the engineering firm, and all the details we need to know. In the past, it was typical to get three or four calls a day from crews trying to find a manhole, and then we had to find a map and send somebody to drive it out to the location. Now they have that data right in their trucks.”
Intergraph Corporation, Atlanta, GA, provided Henry County with the technology, and the company’s director of utilities and communications, Tony DiMarco, notes that systems with meters as sensors are making networks more intelligent. “We build on that for operational support, dispatching crews, workforce management, and trouble analysis,” says DiMarco. “There’s a clear pattern towards more intelligent infrastructure that follows other industries using smart reading and SCADA [supervisory control and data acquisition] technologies, such as communications and electricity utilities.”
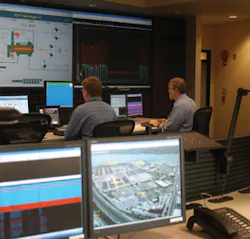
The Expanded Role of SCADA
Many utilities are taking advantage of improvements in SCADA systems, such as the Indianapolis Department of Public Works, where the utility is finishing the construction of a remote-controlled sewer monitoring and operating system that will improve operations throughout the city’s sewer system and reduce sewage overflows into streams.
The SCADA system replaces an outdated sewer alarm system, which provided only limited information to sewer system operators. The new equipment monitors sewage flow, measures rainfall, and detects problems in more than 250 locations, including sewage lift stations and diversion structures that control the flow of sewage to the city’s two wastewater treatment plants.
New options for monitoring and control at sewage treatment plants are enabling great efficiency gains at utilities. In the case of the District of Columbia Water and Sewer Authority (DCWS), Salil Kharkar, manager of process engineering, explains that plant automation made a significant contribution to efficiency in both equipment and personnel at the Authority’s treatment facility. In the late 1990s, DCWS launched a project to upgrade manual operations to a distributed control system, and also made complex capital upgrades. “Every part of the plant would be upgraded, and we didn’t have a design at the time, so we selected Emerson Process Management to integrate its Ovation process control system here,” recalls Kharkar. “So it required a lot of trust between all parties.”
The $1.2 Billion Decade
Ten years and $1.2 billion later, Kharkar points out that benefits associated with the project have been significant and tangible. “Our labor costs have decreased, and staff has been reduced from 160 to 60 operators,” says Kharkar. “To give you an idea of how labor-intensive the original plant was, we have primary clarifiers, and each is served by a central head-house which contains the pumps, and operators had to run up and down three floors of steps to operate the controls manually. Today, we just walk through the system to make sure everything is fine, and all the controls are done centrally with the computer.”
The system also allowed Kharkar to reduce three eight-hour shifts to two 12-hour shifts, and he notes that operators receive better data in real time and can reference historical performance information in order to make decisions based on “data rather than conjecture.” The data also improves the analysis of equipment failures, thus providing the staff with a learning opportunity.
In fact, a couple of hours before Kharkar spoke with Water Efficiency, his plant had a catastrophic failure in one of the gravity sludge thickening units. “It’s a million-dollar piece of equipment that just tore itself apart,” explains Kharkar. “A mechanical piece fatigued below the water surface, and it didn’t show up due to a subsequent failure of an electronic safety device that we thought was working, but wasn’t. We’ll fix both the part and the safety switches on the other seven so they don’t fail.”
Kharkar credits the ability to track down problems, histories, and trends, with allowing his team to quickly discover where the problem started, what failed, and why it failed. “You can build a history or a picture of everything that was running before and after and reconstruct the event,” says Kharkar, “but you can’t do that unless you have all that information at your fingertips.”
Operating as one centralized staff also helps in managing emergencies. Before automation, the plant’s staff operated five different divisions or as “silos.”
“We broke down the silos, and then put all of the control in one location,” explains Kharkar. “For example, even though we’re down to two shifts, we still have 24-hour coverage. The challenge we have is a person coming on duty needs to know what’s happening in their section. Previously, they would rely on logbooks and the accuracy of the reporting and documenting was left up to individuals. Now, with a couple of clicks, we can see trending, and it’s a huge improvement in just being able see what’s happened in the plant in the last 24 hours, and also in the last 48 or 72 hours.”
Thermal Hydrolysis for Cogeneration
Automation and equipment upgrades also boosted energy efficiency at the DCWS. The plant reduced its load from 34 MW down to a range of 26–28 MW. The energy savings came from a combination of variable speed pumps, changing the aeration to a fine bubble system, and placing analyzers and controls throughout the plant. Further efficiency will come with a thermal hydrolysis system that will generate methane gas for a 14-MW cogeneration turbine.
Automation of plant operations continues to evolve, and now it’s making compliance with emergency procedures an easier task. For example, the city of Haverhill, MA, needed to satisfy state mandates that require standard operating procedure (SOP) documents for an emergency response plan to problems such as: excessive chlorine and fluoride events, chemical leak events, and high flow management for the wastewater treatment plant. According to John D’Aoust, manager of the water treatment plant, Haverhill had undertaken written SOPs, but there wasn’t a cohesive system for following through or undertaking critical corrective actions.
Haverhill solved the problem by computerizing its water and wastewater treatment plant with Proficy Workflow, a product from GE Fanuc Intelligent Platforms, Charlottesville, VA. Haverhill’s water treatment plant operates at 5 to 12 million gallons per day, serving about 52,000 households. The wastewater treatment plant treats about 10 MGD, with peak wet-weather flow exceeding 60 MGD. D’Aoust credits the new software with guiding his operations staff through procedures and consistent follow through for the newly mandated plan.
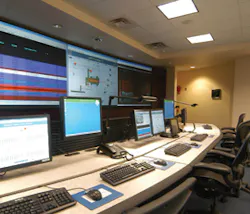
An Alarming Collaboration
The consistency and follow through are important parts of the system, notes Alan Hinchman, global water industry manager at GE. “In a standard utility, we typically see a centralized control room with operators managing something like tap water distribution pressure zones, pump stations, laboratory management systems watching for regulatory things, and meter reading systems,” explains Hinchman. “With workflow, instead of having those four or five independent areas where the operator would get an alarm, we can collaborate all those into a single screen, and the operator can interact directly with the alarm.”
The specific set of instructions is embedded inside the screen with the exact controls the operator needs. If the operator enters a specific value, it can be tagged and reported back into an area whether that’s a historical database for the SCADA system.
Hinchman notes that the water industry is a very important vertical industry for GE, and the company has many products and services currently available, plus many more planned for the future. Considering the opportunities and the fast pace of technologies such as AMI and process control, it’s not surprising that companies such as GE, Emerson, and Veolia are focusing intensely on the industry. And as their products continue to enable a total resource management approach, the industry will gain further efficiencies in energy and water distribution.