Plan On It
The use of two-dimensional (2-D) storm water models has increased in recent years primarily due to advances in software, hardware and the availability of surface data. These advances allow for robust and diverse applications, including basin-wide storm water assessments. Storm water master planning is a critical element of the development of comprehensive state and local agency plans, capital improvement projects and associated budgets.
The Josephine County Public Works Department in Josephine County, Ore., used an integrated one-dimensional (1-D)/2-D model for storm water master plan assessment. When a storm water conveyance system is under capacity, a 1-D schematization alone cannot accurately model flow once it surcharges out of the 1-D elements. The linkage of 1-D and 2-D models allows water to move out of a 1-D element, then return to the same or another 1-D element. This complete description eliminates model losses due to surcharging and inaccurate 1-D description of surface storage. For example, flows leaving an irrigation canal, defined with cross sections in 1-D, can flow overland via the 2-D grid cells to a downstream irrigation canal or stream.
The results of comprehensive hydrologic and hydraulic analysis include the discovery of overland flow routes between open-channel elements during surcharge and 2-D map results, which include depth, volume and the spatial extent of flooding.
Josephine County's Model
The integrated 1-D/2-D model built for Josephine County was XPSWMM, a hyrologic and hydraulic modeling software package provided by XP Solutions. The initial model for this study included only 1-D elements. The catchment was divided into 177 sub-catchments; runoff from these catchments was described using the Runoff method and the Green-Ampt infiltration method. The Runoff method is an industry-standard routing method utilizing the catchment width and slope to characterize the catchment and determine the runoff from there. The Green-Ampt infiltration method is utilized to predict the infiltration. The average capillary suction, initial moisture deficit and saturated hydraulic conductivity are the primary input elements for the Green-Ampt method.
The 1-D hydraulics included all significant elements, such as drainage canals, open channels, all pipes larger than 12 in., streams, roadside ditches and ponds.
The 1-D model was generated as a stand-alone model, not accounting for 2-D linkage, and was calibrated to gauge data collected during the winter of 2010. The results of the 1-D model revealed significant difficulties in capturing an accurate representation of what was occuring in the catchment during larger events. More than 30% of the total runoff generated was lost due to flooding at 55 nodes across the catchment. These results were unacceptable, and it was determined that the best course of action would be a fully integrated 1-D/2-D model.
The resulting 1-D/2-D model developed for this study consists of 979,627 square grid cells, each representing a surface area of 100 sq ft. The 2-D grid is integrated with 1-D elements, which include 5.8 miles of large irrigation canals, 4.22 miles of creeks and 5.44 miles of open channels. These integrated 1-D elements exchange water with the 2-D model via 1-D/2-D interface boundaries placed within the model along the top of the bank for all the open channels.
The Challenge
The area the model was based on presented a challenge due to long-established irrigation canals that flow from east to west across the catchment. Two large canals, roughly 25 ft across and 4 ft deep, bisect the catchment, intercept all runoff from the catchment and move it west. It then makes its way back to the Rogue River, which forms the northern boundary of the basin. The development of these canals forever altered the hydrology and hydraulics of the catchment, creating a unique modeling problem.
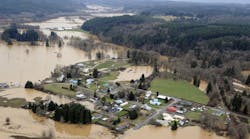
During larger events, these canals flood, as they were not designed for the conveyance of storm water. The result is extensive flooding across the basin and the transfer of significant storm water from the east side of the catchment to the west side. For the 25-year, 24-hour Soil Conservation Service Type 1A design storm for this location, the “fingers” of flooding would all start from one of the main canals. Once these overland or 2-D flow paths are started, they would flow to the Rogue River, where this basin terminates. In multiple locations, there are instances where one of these flow paths will move in and out of five or six unique 1-D elements connected by the linkage with the 2-D domain. This situation required a large and complex, fully integrated 1-D/2-D model to appropriately describe the entire nature of the flooding in the catchment.
Using modeling allowed the project team to appropriately classify the flood-prone areas with a detailed description of the depth, spatial extent and velocity associated with the flooding. Subsequent projects proposed to alleviate flooding were tested within the model, which led to the development of a capital improvement project list.
Download: Here

