Guest Editorial- Continuous Surface Water-Quality Monitoring: Some Insights
Multiparameter sondes are becoming the standard instrument to assess surface water quality. Their ability to measure different water-quality parameters in real time, unattended, and with sampling intervals ranging from seconds to hours, makes them the ideal monitoring equipment to characterize water quality variability in surface waters due to stormwater discharges.
For the multiparameter sonde to fulfill its capabilities, site and station configuration selection must be properly addressed. The monitoring and data quality objectives provide the basic information for site selection. Once the site is selected, the station configuration can be defined.
The Chesapeake Bay National Estuarine Research Reserve in Virginia (CBNERRVA) has been performing continuous water-quality monitoring for more than 10 years. During this time, several techniques and monitoring platforms to maximize the effectiveness and efficiency of continuous water-quality monitoring have been developed. Among these, a specific method on how to approach site-specific characteristics (SSC) during site selection, and some insights on monitoring platforms, can be applied in stormwater management projects.
Site Selection: Site-Specific Characteristics
The monitoring sites must be selected to comply with the monitoring and data quality objectives, but in the real world, ideal monitoring setting conditions are difficult to achieve, and compromises must be made in order to locate the monitoring stations that best represent the environment to be monitored.
Site selection starts with a comprehensive overview of the monitoring area to ensure the monitoring objectives can be achieved, then translating those objectives into a detailed plan to ensure quality data.
This is not a simple task, given that not only must scientific considerations be understood and addressed, but also other site-specific characteristics must be considered and evaluated (Oregon Plan for Salmon and Watersheds 1999). Among these characteristics, biological factors (e.g., plants and animals); hydrological waterbody characteristics (e.g., stratification); climate influence (e.g., icing); human-induced variability (e.g., sediment inputs from farming activity or community development); and natural, temporal, and spatial variability need to be considered.
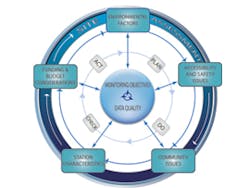
When the different techniques (i.e., professional judgment) are applied to select the sampling locations, certain site-specific environmental, logistic, and management factors must be taken into account. These SSC can compromise the ideal scientific results if they are not properly addressed during the monitoring-site-selection process. For example, site selection can be affected by a site’s accessibility, and certain laws and local regulations may control or prohibit the use of certain types of monitoring station platforms. To systematically address this problem, a management decision support tool called Site-Specific Characteristics Cycle was developed (Figure 1) (Miles 2008a).
The SSC Cycle provides a protocol or a management decision process to follow. It ensures that a standard operating procedure is applied to systematically and comprehensively evaluate the SSC and other factors that are heavily influenced by them. The goal of the SSC Cycle is to create a user-generated expert system based on rules, standards, subject-specific and expert knowledge, and information acquired through field experience, to support the decision making during the site-selection phase of a continuous surface-water-quality project. Five major subject areas were created to organize this information: environmental factors, accessibility and safety, community issues, station characteristics, and funding and budget considerations. In addition, the decision support tool works under the continuous improvement philosophy, employing site assessment as a continuous information collection process in order to take into account the natural and anthropogenic environmental variability. Data are collected continuously during the project to fine-tune and improve the monitoring endeavor, to get a better understanding of the different SSC that affect the project, and to enhance the information in the SSC Cycle.
To create the SSC Cycle, relevant information is gathered under each subject area. For example, under environmental factors, all pertinent information regarding the physical, biological, and chemical characteristics that could influence data quality is organized (i.e., substrate conditions, wave energy characterization, vegetation densities, biofouling, nonpoint-pollutant sources, upstream inputs, and lateral mixing).
The accessibility and safety section contains information regarding local regulations, topography, leases or agreements of water, vandalism or tamper risk, and protection and safety issues. How the information is ordered and presented in each subject area will depend on user needs and preferences. It can be organized from general to specific; checklists with references can be used to perform a quick selection of the SSC; it can be presented as tables where all the information is included; it can be personalized for particular watersheds (e.g., with specific information for lakes, rivers, and estuaries); or it can be written into a computer program as an expert system.To recapitulate, the idea behind the SSC Cycle is to provide a simple method to organize SSC information so project managers and monitoring teams can easily review it when planning the water-quality-monitoring phase of a stormwater management project. By reviewing this information, they can assess possible impacts of the SSC on the monitoring objectives and data quality and can develop a checklist of concerns to be examined during the site assessment (the moment where the planning decisions are evaluated against the real settings). In addition, using such management decision support tool ensures that the SSC are not overlooked or misinterpreted and that the best practices to tackle them are properly addressed.
Monitoring Platforms
Most continuous water-quality-monitoring stations can be subdivided into two main categories, buoyant configurations and fixed-structure configurations (Figures 2 and 3) (Miles 2008b).
The station configuration to be selected depends mainly on the settings of the monitoring location and the design requirements to comply with the monitoring objectives and data quality.
Buoyant configurations are the preferred platform in the following scenarios: when water-quality parameters must be measured at a fixed distance from the water surface, when measurements must be taken at a fixed distance from the bottom in areas where fixed stations cannot be built, when water depths make it difficult or unfeasible to use fixed stations, and when regulations prohibit the construction of fixed structures.
The dimension of the float and the type of anchoring depend on the system purpose or performance requirements, as well as the characteristics of the environment where the buoy is going to be deployed. In most surface water–monitoring cases, it is fairly easy to construct a buoyant platform. For example, to built a subsurface buoy, select or build an anchor adequate for the monitoring site (a 4- to 6-inch section of a 6-inch PVC pipe filled with cement, with an eye bolt inserted on the top, works well for most sites); tie a rope longer than mean high water to the eye bolt, and tie a shackle to the rope so the datalogger hangs at the desire sampling depth; use cable ties to fasten the datalogger to the rope, and attach a small crab buoy just above the datalogger to keep it in a vertical position; and finally, attach a surface buoy to the end of the rope as the site marker.
Fixed-structure configurations are the most common monitoring platforms employed, and among them, existing structures are preferred because of their ease of construction and accessibility.
Independently of the monitoring platform to be used, it is always a good practice to protect the multiparameter sonde from local wildlife, debris, and human tampering (a 4- or 6-inch PVC pipe is generally used for this purpose). One attribute that must be ensured in the design of the protective pipe is that the aquatic environmental conditions inside and outside the pipe will be the same during sampling. To ensure this, at CBNERRVA we drill four sets of 2-inch holes along the pipe and cut four sets of windows (13 by 2 inches) at the bottom of the pipe to guarantee a good water flow. To ensure the monitoring sensors will be positioned at the windows’ depth when deployed, two small bolts are placed at the end of the pipe to act as stoppers. The protective pipe can be fastened to the existing structure using any type of clevis or conduit hangers. It is important to keep some distance between the pipe and the structure to minimize possible effects produced by the structure on the water-quality data (e.g., seaweed growing on the structure).
Designed structures are generally employed when the station must be placed offshore and there is no existing structure at the site. We have found that offshore monitoring stations can be easily constructed using wood, PVC tubing, and antenna towers.Basically, these structures consist of some kind of frame to hold the protective pipe in place. The pile monitoring station is the most basic type of designed platform. Pressure-treated wood, round timber piles (6 to 9 inches in diameter and 14 to 20 feet long) or posts (4 by 6 inches or 6 by 6 inches) are generally employed. Wooden structures are constructed by driving two 16-foot posts (4 by 4 inches thick) into the ground for use as the platform columns. Transverse 2- by 6-inch boards are used to secure the 4-by-4 posts and to hold the protective pipe in place (using U-bolts).
To further increase the station stability, 16-foot (2- by 6-inch) boards are employed as diagonal beams to support the structure columns; these beams are driven into the ground and bolted to the 4-by-4s.
If real-time data stations are needed, 10-foot galvanized tower sections are the construction material of choice. Different structures are used at CBNERRVA to secure the antenna tower in place: a wooden pile, or a wooden/PVC structure.
The PVC structure is constructed by driving three 4-inch, 10-foot-long Schedule 40 pipes into the ground for use as the platform columns (extension pipes may be required; this will depend on the water level and on the penetration depth). Once the PVC pipes are in place, they are filled with concrete or sand and gravel to increase structure stability. The final step is to secure the antenna tower to the three columns using U-bolts.
Generally, the mean and maximum water depth will determine which designed platform is the most feasible to construct. For example, the 16-foot, 4-by-4 posts work well when the mean high water level is less than 8 feet, using a penetration depth of 6 feet. For deeper waters, a longer post could be employed, but this complicates the construction. The better option is to use PVC pipes, given their extension capabilities.
Conclusions Surface-water-quality monitoring is an integral part of any stormwater management program. To best assess the negative impacts of stormwater runoff on human health and on aquatic ecosystems, monitoring sites must be adequately selected. The SSC Cycle provides a standard operation procedure that ensures the quality and consistency of the site-specific characteristics assessment, and the implementation of good monitoring practices to address them. The monitoring platform summary provides guidelines to enable maximize the effectiveness and efficiency of the station configuration selection process. Due to the wide range of site-specific characteristics, most monitoring platforms would require custom modification and best engineering judgment to obtain good quality measurements. Based on experience gathered at CBNERRVA, it is a good practice to review, at the beginning of the station selection process, the different types of platform configurations and assess which configuration can work best in the specific monitoring environment.


