Illicit Discharge in Milwaukee
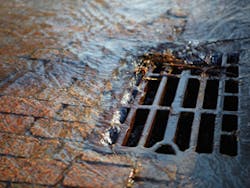
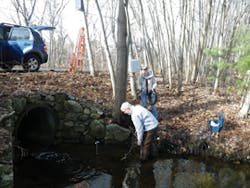
It’s part of Patrice Eucalano’s job with the city of Milwaukee, WI, to monitor stormwater before it enters the local rivers. “The goal of the city’s stormwater monitoring program is to detect and eliminate illicit discharges to the MS4 [municipal separate storm sewer system],” she explains. “As part of the illicit discharge detection and elimination [IDDE] program, the monitoring and testing is done during dry-weather flows only. The city has 733 outfalls, of which 53 are tested semi-annually, 118 are tested annually, and 562 tested every five years.”
Monitoring kits from CHEMetrics have been a staple of the city’s monitoring program for some time. Specifically, Eucalano says, the city uses CHEMetrics test kits for phenols, copper, ammonia, chlorine, and detergents. The detergent test kits come 20 units to a box and the phenols, copper, and ammonia kits 30 units to a box, she says. “In 2011, the city’s stormwater testing used 16 boxes of phenols, 12 boxes of copper, 32 boxes of ammonia, 18 boxes of chlorine, and 30 boxes of detergents.”
She explains, “The city uses ammonia testing as the primary component of its illicit discharge program. Ammonia testing during dry weather is used in locating sanitary sewer cross connections. We also use detergents to test for surfactants, which are additives in detergents (soaps). We use phenols to test for heavy or industrial cleaning solutions. We use the copper test to identify the presence of copper that may be present in condensate system and heat exchangers, and which is toxic to aquatic life. In addition, we check pH level and temperature and also make notes concerning color, odor, sheen, and turbidity of the water.”
Depending on the purpose of its stormwater monitoring, some communities will institute “first flush” monitoring, or may check after a rain event of a certain size, or perhaps will arrange for automatic monitoring at given time intervals. For Milwaukee’s IDDE program, however, none of these approaches was selected.
“As mandated by the Wisconsin Department of Natural Resources,” says Eucalano, “our monitoring is done during dry weather only. In fact, we wait at least 72 hours after a measurable rain event before resuming testing.”
To conduct the analysis of stormwater samples, the city uses the Visual Colorimetric Analysis method. “The CHEMetric testing results are color coded and known almost immediately by comparing the ampoules with their corresponding comparators,” she explains.
“There is a specific form created for stormwater monitoring purposes. Test results and other relevant data are written down by hand at the test site. The results get transferred into a Microsoft Access database. We use these test results to identify possible locations of illicit discharges or illegal connections.”
Near-real-time testing of temperature and conductivity of highway runoff
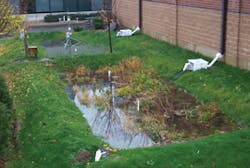
Eucalano describes some of the other components of Milwaukee’s stormwater program. “The city has developed and implemented a municipal stormwater management program, which helps reduce nonpoint-source pollution and sewer overflows. This program will continue to achieve compliance with the developed urban area performance standards of the state regulations. The city also implements various best management practices such as rain gardens, filtration areas, bioretention areas, and detention ponds. Milwaukee also requires reduction of total suspended solids from developments and redevelopments as required by its stormwater ordinance.
“There are no plans to change our illicit discharge and illegal connection program testing methods,” she adds. “We do update our own outfall maps to reflect any changes made within the MS4. We continue to review our outfall testing results and adjust our frequency of testing if necessary.”
Chloride Levels in Massachusetts
The community of Wilmington, MA, located about 20 miles northeast of Boston, has four active groundwater sources for its drinking water, the largest of which is the Brown’s Crossing Wellfield. Doug Heath, a hydrogeologist with the EPA’s Region 1 in Boston, explains that a monitoring site in the area has been set up, as part of a larger study, to monitor sodium chloride levels in the water, largely as a result of deicing chemicals used on a nearby interstate highway.
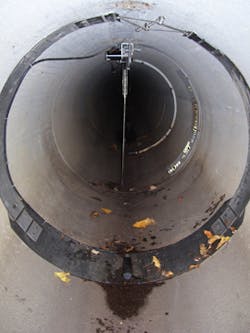
“A colleague and I set up a YSI telemetry station on I-93 in Wilmington right next to a large stormwater outfall that collects a considerable amount of stormwater from eight lanes of interstate highway,” he says. “This location is 2,000 feet upstream of Brown’s Crossing. Near-real-time testing of temperature and conductivity take place within a large culvert, about 3 feet in diameter, which drains about 1,000 feet of highway.”
Heath explains that measuring conductivity is an indirect method of obtaining sodium chloride levels, which is one of the primary goals of the EPA study. “Conductivity is the measurement of the ability of water to conduct electricity. The more ions you have in the water, such as salt or other ions, the lower the resistance and the higher the conductivity of the water. It’s a bulk indication of pollution. Of course, salt is a very strong set of ions, with sodium and chloride ions, so you’ll get pronounced peaks of salty water that these devices pick up during thawing events after salt has been applied to pavement.”
“What is happening in general over the last several years is we keep adding more salt to the roads to keep them safe in the winter time, and the salt level keeps going up in our groundwater,” says Tom Faber, project coordinator with EPA Region 1. “It’s getting into our streams. Not only is it hurtful for the aquatic life, but when it gets into our drinking water supply, it’s a health issue as well for us.”
Indeed, according to a paper by Heath and fellow hydrogeologist Marcel Belaval, chloride levels at the Brown’s Crossing Wellfield are currently in excess of 20 times the level measured prior to 1960, when I-93 was opened.
Faber explains that EPA has set up the YSI telemetry station using YSI 600OMS probes, and the YSI EcoNet service. Heath also utilizes a number of Onset HOBO data loggers to measure temperature and conductance.
“These YSI samplers have probes,” says Faber. “There’s a temperature and conductivity probe out and we can go to the website and pull up the data. It’s logging data every 15 minutes. If there’s a storm event, and we want to see what the loading to the stream is, we can pull that up. If we need to go out and take confirmation samples, which help us correlate the chloride levels with our probe reading, we can go out and measure the high reading, depending on how the salt is melting and how it is applied.”
Heath explains that the HOBO data loggers are much smaller than the YSI units, about 1 inch in diameter and 6 inches long. “They are also calibrated differently than the YSI units,” he says. “With the YSI units, you can actually put in calibration corrections, while immersing the datasonde into a standard. With the HOBOs, they are factory calibrated, but you can make adjustments on the data after you download them, based on measurements taken with field meters, both before and after. So those are the major differences.”
He appreciates the convenience of the system. “I can sit at my home computer or in the office and just dial up the information to see what’s going on. The advantage to this is that I’ll be able to monitor peaks of stormwater runoff during freezing rain or thawing events.”
When such events occur, Heath explains, “That’s going to free up all the residual salt that’s lying out there on pavements and in snow piles. That’s all going to start flowing into the stormwater drainage network, right by this location. I’ll be able to measure how high that’s going, then run out there and take a sample at near its highest concentration, typically around 20,000 to 30,000 microsiemens per centimeter, the kinds of readings we get for these pulses coming off the highway. We’ll be able to take samples, the peaks, of the stormwater runoff concentrations.
“We’ve done that before in other studies; we’ve been doing this for about 10 years. But this is the first time we’ve used a real-time telemetry station to do this kind of monitoring, which has been great. In the past, I was never fully aware, in taking graph samples, when exactly peaks were occurring. I had to guess, but now because of this station, I’ll be able see when they occur.”
When a storm event does occur, the data Heath monitors leave telltale signs. “You’ll see a big change in conductivity,” he explains. “If you get a lot of rain, that will dilute the water and drive down the conductance quite a bit. If you have salty water coming off the highway from road salt applications, as you get during the winter months, you’ll see the opposite.
“This happens very fast, generally within two hours. You’ll go from what it was before, say around 1,500 microsiemens, then it will shoot up to 30,000 microsiemens within a couple of hours. So it’s very fast and very flashy.”
Rain garden monitoring
Heath says he’s been very pleased with the system currently in place, but he did face a couple of challenges along the way. “One was gaining access to the site. It’s a privately owned location, so we had to ask the homeowner in order to set it up. The second issue was that we had to hide the device, so people wouldn’t be fooling with it.”
Faber notes that detecting elevated chloride levels can result in modifications of the road salting process. “The department of transportation has been using different application technologies that now have a liquid sprayer, which is a more efficient system. Their applications can definitely be modified. It’s a balance, too, because it’s safety against health, so it’s a push and pull.”
Correcting Stratification Bias
“What I’ve done over the past 10 to 15 years is to focus specifically on urban hydrology–storm sewers, urban runoff, and BMPs that treat that type of urban runoff,” says Bill Selbig, of the US Geological Survey’s Wisconsin Water Science Center. “This could consist of anything from proprietary BMPs like settling tanks, to those that are more generalized and nonstructural, like street-sweeping.
“A lot of our projects have a specific focus,” he notes. “Usually what happens is we’ll create five new questions while we answer one. It’s this tree that develops new branches, and we go off in different directions while still satisfying the main goals of our original project.
“From one of those branches, I’ve gone out and focused more on sediment transport in storm sewers,” continues Selbig. “Now a lot of my research has been focused strictly on that. We’ve developed a new prototype sampling device that mitigates a lot of the solid stratification bias that you find in storm sewers.
“I remember perhaps five years ago there was an article in Stormwater that focused on exactly that. The bottom line was that a new sampling device needed to be invented. So we’ve done that.”
Selbig says he’s spent the past five years focusing on developing and testing that new device. “We just got done testing it in the lab, and we’ve been cranking out papers, trying to spread the word that we realize that stratification bias exists, and we know that the majority of the urban runoff concentration data gathered over the past several decades is probably flawed to varying degrees. Not all of it is bad, but probably a fair amount of it. Here we have a new way of approaching water-quality sampling that helps get us closer to the right answer.”
Inside a storm sewer
Selbig explains the issue of stratification bias: “What we found is that in a storm sewer, circular pipe, or any closed conduit, you have coarse particles, and you have fine particles. It’s Stokes’ Law that says that bigger particles have a higher density, so therefore they settle faster. Even in turbulent water that’s moving fairly quickly in a storm sewer, if you have solid particles that are of sand size–defined as 63 microns or greater–they fall out of suspension very quickly. The larger the particle, the faster it falls out of suspension.
“In the past, the way you would sample a storm sewer is to just put a sample intake tube on the bottom of the pipe. Whenever there was water, you would start sucking away. If there are coarse particles moving through that storm sewer, you’re basically sampling in an enriched zone. Therefore, when we say bias, we mean you’re biasing that concentration on the high end. You’re probably getting some of the finer particles, but you’re overestimating the number of coarse particles in this enriched zone. The consequence of that is that you have suspended sediment concentrations, or total solids, that are likely too high. And you would have particle size distributions that are on the coarse end. Maybe your median particle diameter is calculated at, let’s say, 250 microns, when it’s really only 63 microns. That’s stratification bias.”
Selbig’s new device is known as DISA, short for depth integrated sample arm. “That’s exactly what it does,” he says. “It takes that sample tube and it mounts it to a reticulating arm, which can move up and down or anywhere in between, depending on the depth of the water. It collects multiple samples from numerous points spaced vertically throughout the water column.
“So now you’re collecting one near the water bottom, but you’re also collecting one in the middle, and one near the top. That way, you’re creating a better average condition, a better representation of the entire water column, rather than just what’s hovering down at the bottom of the pipe.”
Depending on the project at hand, Selbig will monitor for any number of pollutants in the stormwater. “For most of our projects, we try to establish a lab budget that will cover everything. Primarily what we’re interested in are the organic and inorganic constituents. For example, inorganics would be trace metals, phosphorus, nitrogen, and other nutrients. For organic elements, we’re typically interested in PAHs, or polycyclic aromatic hydrocarbons. Outside of these, the other two parameters that we usually test for are suspended sediment concentration and particle size distribution. That usually gives us a pretty broad picture of the types of pollutants that we’re dealing with. Those are really the ones that are of main concern to our state environmental regulators.”
The Wisconsin Department of Natural Resources has been impressed with the DISA unit. “Once they started seeing the results we were getting back, that was it,” according to Selbig. “In their minds, the only way you can sample now in an urban environment is with DISA. All future projects that we conduct are going to be done that way. Within this office, for all water resources projects in the state that are going to be sampling urban runoff in a storm sewer, we are using this product.”
The DISA data that have been compiled confirm the stratification bias that concerns Selbig. “What I can tell you is that it is very clearly obvious that coarse material hovers near the bottom, and it gets finer near the top. The other thing we found in the laboratory is that four subsamples were better than three, which were better than one. The bottom line is that the more points you subsample vertically throughout the water column, the better your answer is going to be. That’s just common sense.
“Ultimately, the best answer would be if you had a continuous pump, and you sucked from the bottom all the way to the top. We can do that, but there are certain limitations that prevented us from doing that. Specifically, we would have to custom-create our own pumping mechanism, and would have to create some program to control that. We wanted to stick with something that would mesh well with off-the-shelf products, and that’s what ours does. Right now, our DISA is the only unique thing. All you do is simply attach it to an existing Isco sampler. There’s really nothing else you need to change.”
Selbig also notes the improved method of data transmission now being used. “All of our sites are set up for remote telemetry,” he says. “Back in the days with landlines, we would have them hooked up to a landline telephone. Then we moved to cell phones and analog transmission, but now with digital transmission, we’re using Raven modems–wireless modems that talk through the Internet–so we can dial up any IP address for instantaneous transfer. We do that because we get two-way communication.
“Most of the USGS is set up to use a satellite, and some of our sites are set up that way, but that only allows one-way communication. You’re unable to talk to it, you’re only able to retrieve data. But a lot of our sites are time sensitive and remote enough that we can’t get out there if something needs to be changed. The Raven modem allows us to see what’s going on in real time, and we can change thresholds in real time, we can move sample arms and respond if there’s something that needs to be done immediately.”
Once the samples are obtained via the DISA unit, a couple of steps are necessary to obtain particle size distribution readings. “Once we have our water sample in our container, we’ll take it back to our laboratory, to process it for analytical testing,” explains Selbig. “That can be done in a number of different ways, but typically we’ll use a churn splitter. Say a storm comes through and we’ve sampled it and have about 20 liters of water that we captured. The analytical lab that we use only wants perhaps a liter of water. So we need to pare that 20 down to one. We’ll use a churn splitter, which is basically a large bucket that you pour all your water into, and split off whatever you need.
“The DISA is a means to collect the water. It doesn’t store the water itself. It’s simply a metal arm that moves up and down, so that when there’s a pump, it can draw the water from the right spot. Then that pump pulls the water into a regular Isco sampler, which has containers to hold it. So we’ll collect the water after a storm and bring it back to our lab and process it.”
At that point, the laboratory uses a Laser In-Situ Scattering and Transmissometry (LISST) particle size analyzer from Sequoia Scientific. “There are a number of LISST devices,” says Selbig. “I believe that all but two of them are set for stream settings. They’re fairly large, and you just put them in the stream, and they’ll read particle size distribution that way.”
For field testing, a LISST-Portable device is currently being used. The same type of device was also used during lab testing to collect samples from a storm sewer that had been set up in the laboratory. “It was really handy, and we’re very pleased with that product,” says Selbig. “[Sequoia] has been very helpful whenever we would have some complications or technical problems.”
The LISST-Portable can be transported easily. “It’s a very small unit. It allows us to take it from one site to the next and get nearly instantaneous results.”
Selbig explains the practical effects of having accurate particle size distribution readings, free from stratification bias. “This new distribution can be inserted into the model to help the engineers who are designing a wet detention pond, for example. That’s the type of information that’s very important to them. It ultimately will determine if a pond is 200 square feet or half an acre in size. That, of course, means money. The more land you need, the more expensive it’s going to be to build the thing.
“What we’re hoping is that the data coming from our research will help both engineers and regulators to design stormwater treatment facilities that are not unnecessarily costly.”
Another implication of the research, he says, involves the Wisconsin Department of Natural Resources requirements for new development, which mandate 40% total suspended solids (TSS) removal by 2013. “It may be down to 20% right now,” he says. “Let’s say, for example, that the city of Madison has to put in certain practices, such as street sweeping, detention ponds, biofiltration swales, and grass swales. Each one of these gets prescribed a benefit of a certain solids reduction. They have to prove to the state that they are going to reduce their overall total suspended solids by 20%. What we’re realizing now is that the data that has been collected to characterize how much is actually coming off of these surfaces—streets, parking lots and so on—is wrong.
“Our regulator, the DNR, may realize that 20% may have to go up to 50%. Who knows where that’s going to go? That’s down the road a bit. But these are the kind of conversations we’ve been having.”


