Reversing the History of Urban Hydrology
Can we reverse the impacts that urban areas have on our surface waters? And can it be done economically? It is expected that the country will see increasing difficulty in accessing adequate quantities of clean water unless well-laid plans are followed to preserve and protect it. Stormwater professionals will play important and necessary roles. This is currently playing out around the country in urban areas, of which many have fallen under federal civil enforcement action such as administrative agreements and consent decrees. In these cases problems have been deemed severe enough to significantly threaten the health, safety, and welfare of the public. Typically these actions require incorporating green infrastructure practices to mitigate pollutant loading and reduce runoff volume contributing to sanitary or combined sewer overflows.
Green infrastructure works somewhat in reverse to traditional gray infrastructure by decentralizing stormwater practices to meet volume and quality standards onsite. It is expected that the eventual revised national stormwater rule will emphasize retention-based performance standards while encouraging a watershed approach to stormwater management. This is a logical, science-based approach that, if implemented well, would produce significant overall benefits to the health, welfare, and safety of our nation’s water resources and associated human environments.
Changing the composition of the pavements themselves to mitigate the lost retention and infiltration function in heavily urbanized areas makes the most environmental sense, and in many cases may be the most economically viable. The degree of retention and infiltration that naturally existed prior to development can be matched, and in many cases exceeded, by retrofitting developed areas with porous pavement and infiltration systems. As you read this article it is important to note that in the mid-Altantic region, infiltrating the 2-year storm can reduce the 100-year storm to the predevelopment level (Potts, Adams, and Cahill 2009). The average precipitation depth of the 2-year, 24-hour storm in the North Carolina Piedmont ranges from 3 to 3.5 inches. The 2-year, 6-hour storm for the Charlotte, NC, region is around 2.3 inches. So in essence you are trying to revert and/or maintain an SCS curve number (CN) of 50 or less. An area that consistently retains 2 inches of rainfall would have a calculated CN 50, which is below the SCS Cover Type of Woods in “good” hydrological condition within the hydrological soil group B.
An equally important motivation, perhaps larger than environmental benefits, is cost savings for cities that face increasing costs for stormwater infrastructure projects to meet federal regulatory requirements. However, the stumbling block to widespread voluntary implementation by stakeholders seems to be cost-benefit data and data supporting long-term efficacy. Although there is a lot of data out there supporting cost and efficacy, it is challenging to compile and filter for specific regions and climatology. Skepticism also still persists regarding implementation of stormwater infiltration practices in clay soils (Estes 2009) and long-term maintenance costs.
Recent research completed by Megan Gray at the University of North Carolina Charlotte (UNCC) utilizes ArcGIS and HydroCAD to predict the probable average SCS curve numbers when retrofitting heavily urbanized watersheds with permeable paving systems. The research attempts to give insight to the probable outcome in flood reduction and water-quality improvement on a watershed scale through modeling several urban permeable pavement retrofit scenarios using data from an actual constructed project. Three years of thorough and comprehensive monitoring data of a pervious concrete infiltration system that was designed and constructed in typical Piedmont clay soils in the North Carolina Piedmont was used. A cost analysis was also conducted that compares costs of alternative approaches to volume and water-quality practices.
Infiltration Research
The preliminary research was highlighted in a previous Stormwater article titled “Stormwater Infiltration in Clay Soils” (Stormwater, January/February 2009). Since the publication of that article, UNCC monitored the project for an additional two years. The data from the Wilmore Walk project demonstrated the infiltration performance of a basin located under a pervious concrete parking lot in a multifamily residential development. This example provides validation of the concept of a low-impact stormwater project in the urban landscape, demonstrates the successful use of pervious concrete, and quantifies design criteria for clay soil infiltration.
Located in Charlotte, NC, Wilmore Walk is a 2.84-acre condominium development that was constructed in the summer of 2005. The site design was analyzed for opportunities to incorporate various stormwater best management practices (BMPs). One of the opportunities identified was stormwater infiltration in the form of a 0.14-acre porous concrete parking lot.
The existing soils are Cecil sandy clay substrate. According to the NRCS Soil Survey, the site was mapped as soil unit CuB and CuD. This soil unit is composed of approximately 49% clay, 25% silt, and 30% sand.
Preconstruction infiltration testing was conducted for the proposed subgrade of the pervious concrete parking lot. Test results yielded a range of 0.23 to 3.1 inches per hour with an average infiltration rate of 0.90 inch per hour for the existing unmodified sandy clay subgrade in dry condition. The lowest rate of 0.23 inch per hour was measured in an area of light compaction caused by construction equipment. The highest infiltration rate, 3.1 inches per hour, was measured in an area that was cut-raked, with no compaction.
Pervious concrete was chosen as the material for the porous parking lot because of its high infiltration rate, durability, and ease of maintenance. The infiltration efficiency of pervious concrete depends on the consistency of the mix and quality of the installation but typically exceeds that of all other manufactured paving systems. Properly installed pervious concrete contains 15% to 30% void space throughout the entire volume of the application. The voids increase in size from top to bottom of its cross section, greatly reducing the chance of clogging. Typical flow rates through pervious concrete exceed 1,000 inches per hour. Six inches of pervious concrete can, on average, detain and store 1.5 inch of rainfall. A reservoir base course composed of single-size aggregate with approximately 40% voids was designed to retain, at minimum, the 2-year-recurrence storm event for the parking lot and some adjacent rooftop drainage area. The base reservoir was excavated into existing soil as a closed basin; there is no primary drainage outlet except infiltration into the soil. The base’s aggregate material was placed on a scarified subgrade with minimal compaction.
The first post-construction infiltration monitoring was performed by Estes Design Inc. for a six-month period from August 2006 through February 2007 and is described in detail in the 2009 Stormwater article referenced earlier.
Beginning in March 2007 and ending June 2009, investigators from UNC Charlotte’s Department of Geography and Earth Sciences were hired by the City of Charlotte Stormwater Services to monitor the performance of a porous pavement stormwater infiltration system. The report was compiled and completed in May 2013 (Gray 2013).
The monitoring study had three major objectives:
- Quantify the water table response in the storage reservoir underlying the permeable concrete to precipitation inputs of different magnitudes.
- Evaluate the long-term (two-year) performance of the structure with regard to changes in percolation (clogging) and drainage (infiltration).
- Characterize water-quality constituents and their concentrations in infiltrating stormwater beneath the structure.
The study was designed to provide the city’s stormwater management with a comprehensive, long-term performance database with which to assess the utility of permeable pavement as a stormwater BMP in an urbanized Piedmont setting.
In addition to the monitoring study for Charlotte Stormwater Services, three other separate aspects are included in this research study:
1. Evaluate the utility of using the commonly applied Green Ampt approach to model the infiltration response within the storage reservoir after precipitation events.
2. Model and evaluate the potential effectiveness of multiple, spatially distributed permeable pavement installations on stormwater runoff at the watershed scale using ArcGIS and HydroCAD modeling software.
3. Compare the cost effectiveness of permeable pavement as a water-quality and stormwater BMP to other commonly employed stormwater control measures. In the interest of brevity, objectives 3 and 4 will not be covered in this article and the reader’s attention is directed to the research paper for more detail.
The method to monitor the hydrologic response to precipitation events begins with the installation of three Global Water Instrumentation Inc. (GW) pressure transducers into three access wells situated in the porous concrete structure. Because of noisy output from the GW devices, three Odyssey Capacitance-type water-level recorders were installed alongside the GW recorders. The water levels for all six loggers were recorded every five minutes.
Precipitation inputs to the structure were measured and recorded with a HOBO RG3 recording rain gauge. Precipitation input was also recorded manually after every rain event with a standard metric Tenite rain gauge. Air temperature and relative humidity were also recorded at the monitoring location with a HOBO combination temperature/RH logger.
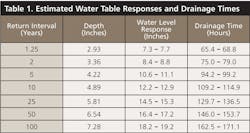
Over the duration of the study, 31 precipitation events were recorded and monitored. These precipitation events produced water-level responses within the permeable concrete reservoir ranging from 0.05 inch to 14.63 inches. The largest water-level response of 14.63 inches occurred on August 26, 2008, which was a 5.7-inch event in less than 7 hours. The average of 0.041 inch per hour was used in the calculation to determine that it takes approximately 61.0 hours for a 1-inch rainstorm to infiltrate through the permeable pavement system and into the subsoil. Relative to other studies examined in the literature review, Wilmore Walk’s infiltration rate results indicate that it is on the lower end of the infiltration rate spectrum when compared to other studies, and indicates a reasonable rate over clay-type soils. A crushed rock reservoir averaging 8 inches thick would accommodate a rainfall event of approximately 3.10 inches before significant storm drainage overflow would occur. The design storm for flood protection in Charlotte is the 10-year, 6-hour event of 3.6 inches. With the exception of the August 26, 2008, event, the estimated water-level response for 18 inches of stone reservoir depth would contain all 6-hour-return-interval storms including the 100-year and all of the 24-hour-return-interval storms except the 100-year. Preliminary testing was done prior to the UNCC study using a water truck to completely fill the reservoir and is described in the 2009 Stormwater article. A summary of estimated water table responses is shown in Table 1.
One primary objective of this study was to measure the medium-term performance of the permeable concrete surface and to measure any changes in the infiltration capacity of the subsoil. As of 2009, there was no significant change in the rainfall-water table responses. This indicates the infiltration capacity of the permeable concrete surface is not reducing. In 2011, an ASTM C1701 infiltration test was performed on the concrete surface. With the exception of two areas, each approximately 6 feet square, at the entrance drives, the infiltration rates exceeded 1,000 inches per hour. The areas at the entrance drives seemed to be clogged where vehicles cross over a monolithic concrete divide that separates the asphalt driveway from the pervious concrete. For the past nine years, the only maintenance has been sweeping. During the UNCC study in the fall of 2007, it was noticed in several places that the upper surface of the permeable concrete was beginning to show signs of raveling. Areas of raveling are limited to just the surface of the pavement and only to a small portion of the total surface area of the site. To the date of this article, raveling has not appeared to progress further. With regard to the infiltration capacity of the subsoil, during the two-year monitoring period, the regression relationships display slightly negative slopes, which suggests that infiltration rates may be declining slightly over time. There was extensive scatter in the estimated infiltration rates, and the ranges show an overlap of infiltration rates over the duration of the study. The author believes that filter fabric installed at the bottom of the reservoir may possibly have accumulated initial gravel fines.
The Watershed Scale
The watershed modeling phase of research completed by UNCC utilizes ArcGIS and HydroCAD to predict the probable average SCS curve numbers when retrofitting a heavily urbanized watershed with permeable paving systems. The Wilmore Walk project is located in a sub-basin of the Irwin Creek watershed in the metropolitan area of North Carolina.
Four scenarios are modeled that include
1. Existing condition.
2. Parking lots, driveways, and sidewalks are permeable.
3. Secondary roads are permeable.
4. Parking lots, driveways, sidewalks and secondary roads are permeable.
For this study, impervious = CN 98 and permeable = CN 61.
Stormwater Modeling: SCS Runoff Curve Number Method with ArcGIS. The Wilmore Walk sub-basin National Elevation Dataset (NED) was applied to a raster calculator to create a precipitation map for the seven storm scenarios used in this study.
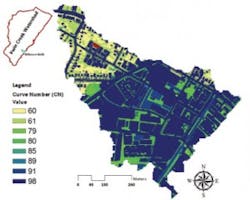
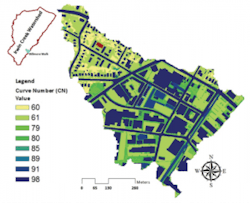
The SSURGO Soil Hydrogroup Map variable was combined with the Land-Use Map to create a combined map that is reclassified four times to represent the four scenarios of this study. The values of the combined soils and land-use map and the curve number classifications are shown in Table 2. The summary of pervious vs. impervious surfaces for each scenario is shown in Table 3, and any CN value less than 98 was considered somewhat pervious. Two example CN maps, using ArcGIS, are shown in Figure 1 and Figure 2.
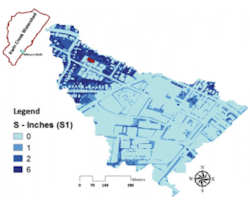
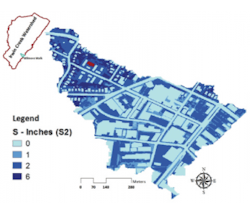
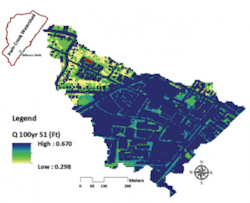
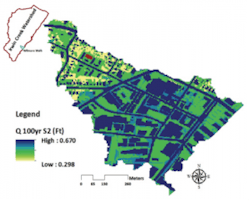
The four CN maps were applied to the Equation S = (1,000/CN) – 10 resulting in four S-maps. Examples are shown in Figure 3 and Figure 4 for scenarios 1 and 2. Each precipitation map or “P” variable (seven maps) and each of the four S-maps were applied to the SCS Runoff CN equation Q = (P – 0.2S)2/(P + 0.8S) to generate separate Q (Runoff) map for each land cover/precipitation scenario. Examples of a runoff map for scenarios 1 and 2 related to a 100-year storm event are shown in Figure 5 and Figure 6. Accumulated Runoff (AQ) maps do not show noticeable visual differences between each scenario, and the total runoff values from each map are summarized in Table 4.
Stormwater Modeling: SCS Runoff Curve Number Method with HydroCAD. The same precipitation and CN data used in the ArcGIS model was also applied in the HydroCAD stormwater modeling software. The main difference in this approach is the use of time of concentration (Tc) data.
The Tc data varied with each model scenario—i.e., in scenario 2, the Tc data for a parking lot would be replaced with the Tc values for grass. The Tc data require an average slope for each flow segment, which is the only slope or elevation data used in this method.
The final runoff results from the HydroCAD models for each scenario are shown in Table 4. When comparing the ArcGIS and HydroCAD results, the smaller storm results show a significant difference in runoff totals, with differences between the two methods decreasing with increasing event size. When comparing scenarios 1 through 4 for each storm interval, the expected reductions in runoff levels for with increasing imperviousness are evident.
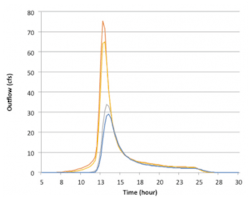
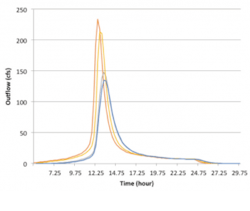
Figure 7 and Figure 8 display the predicted runoff results for all four CN scenarios as modeled with the HydroCAD approach for a 1.25-year and a 100-year, 24-hour event. All four scenarios show the expected general outflow responses for both rain events. Beyond peak flow reductions, model scenarios 2 and 4 also show that the peak flows for both storm events are delayed by ≈ 30 minutes when compared to scenarios 1 and 3. The runoff data for scenario 1 indicates that the peak flow of the 1.25-year, 24-hour storm (Table 5) is reduced by 55% in scenario 2, by 13% in scenario 3, and by 62% in scenario 4. The runoff data for scenario 2 indicate that the peak flow for the 100-year, 24-hour storm (Table 6) is reduced by 37%, by 8.5% in scenario 3, and by 42% in scenario 4.
As expected, the simulations suggest that scenario 4 (pervious parking lots, driveways, sidewalks, and secondary roads) will have the most impact at the watershed scale in reducing stormwater runoff. A comparison with scenario 2 indicates that parking lots, driveways, and sidewalks account for the majority of the reduction in runoff. It must be recognized that aspects of scenario 2, however, may prove difficult to convert to pervious pavement because the majority of this type of land use is privately owned. It would require the support of local and state governments via tax credits and incentives and likely redevelopment ordinances for these surfaces to eventually be converted to pervious pavement. If the majority of the currently paved surfaces were converted to pervious pavement, the application of pervious pavement has the potential to have a significant impact on reducing and delaying stormwater runoff within a highly urbanized watershed.
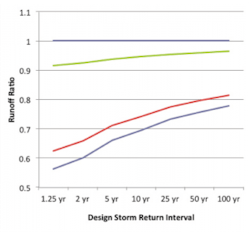
A comparison of the ArcGIS and HydroCAD results for each pervious pavement application scenario under each rain event return interval is presented Figure 9 and Figure 10. The ArcGIS runoff results indicate an even and steady decline in the difference in runoff ratios with increasing storm size, whereas the HydroCAD results display a much greater reduction in runoff under the scenario 2 pervious pavement application as compared to the ArcGIS methodology. This is likely attributable to the HydroCAD software utilizing additional site-specific variables in addition to CN data to determine the runoff hydrograph for each scenario. HydroCAD uses Tc data, Manning’s equation values (which represent surface roughness), and site-specific flow path values that are not included in the ArcGIS method.
Existing stormwater infrastructure (i.e., storm drains) was beyond the scope of this study, and the actual magnitude of the runoff peak flow reduction and the timing of the peak flow from these two simulations would likely differ if it were included. To incorporate stormwater infrastructure, a model such as EPA’s Storm Water Management Model (SWIMM) would need to be applied.
Cost-Benefit Analysis. A key impediment to voluntary adoption of green infrastructure is cost. Because of a lack of understanding of construction cost and long-term maintenance obligations, the perception may be that green infrastructure is too expensive. Regions required to meet green infrastructure goals under federal enforcement actions are typically finding this not to be the case. It has been estimated that green infrastructure is 5% to 30% less costly to construct and about 25% less costly over its life cycle than traditional infrastructure (Kloss and Calarusse 2006, Garrison and Hobbs 2011).
In this phase of the research the estimated range of cost per square foot, advantages and disadvantages, and estimated lifespan for each BMP is examined. The overall cost per square foot of land within the Wilmore Walk sub-basin was retrieved from tax values of the parcels. The estimated construction and maintenance cost results for porous asphalt (PA), permeable concrete (PC), permeable interlocking concrete pavers (PICP), wet and dry ponds, bioretention, and infiltration basins were investigated. Underground detention and underground detention plus sand filter were not included in the original UNCC study, but an example cost study for these facilities was retrieved from a Charlotte Transit study within immediate proximity of the project site and is included below. Also, since the UNCC study was completed, the City of Charlotte added permeable pavement to its list of acceptable water-quality BMPs including peak attenuation, volume capture, and built upon area credits.
Annual maintenance costs (AMC) were determined according to the reported percentage of construction costs or costs per acre from the EPA fact sheets for each BMP. Wet and dry ponds were reported to have an annual maintenance cost of 3 to 5% of total construction costs. Bioretention areas have an assumed annual maintenance cost of 5 to 7%, according to EPA’s 1999 preliminary study, “Cost and Benefits of Storm Water BMPs.” Infiltration trenches have a reported maintenance cost of 5 to 20% of total construction costs. For the purposes of this study, the highest reported percentage was used to calculate the AMC values for wet and dry ponds, bioretention areas, and infiltration basins. This is to simplify the reporting of AMC and overall costs to make it clear what the highest expected costs might be for each BMP type. Each pervious pavement’s AMC values were calculated using the reported maintenance values within the 1999 EPA fact sheet on Porous Pavements, ≈ $200 per acre. The $200 per acre was adjusted for inflation from 1999 to 2013 to a value of $278.71 per acre. The total maintenance costs (MC 20YR) for all BMPs were calculated by multiplying AMC results times 20 years, the general lifespan of a stormwater BMP.
The average construction and maintenance costs for PA, PC, and PICP, shown in Table 7, are similar and range from $6.42 to $8.44 per square foot. The actual cost of the Wilmore Walk parking area was $12 per square foot. This increase is due to the additional gravel depth to handle the larger storm events. The referenced values for PA, PC, and PICP were adjusted for inflation for the year 2013 to ensure consistency. The estimated cost of the application of PC for scenario 4, where driveways, sidewalks, parking lots, and secondary roads are considered pervious for Wilmore Walk sub-basin is $2.75 million less than PA for the same scenario. While PA, PC, and PICP are similar in cost, it is important to note that when installed over a large area of 10 acres or more, the difference of $2 per square foot can have a large impact on the overall cost.
The overall cost for wet retention and dry detention ponds are determined by adding the following items: land costs (LC overall) + total construction costs (TC X) + maintenance costs for 20 years (MC 20YR). In a side-by-side comparison for a 4.80-acre area, retention and detention ponds designed to handle a 25-year, 6-hour design storm (4.80 acres surface area with 5-foot depth) are approximately one-half of the cost of construction for PC using a 6-inch stone base. However, when including land costs, the overall costs for a 4.80-acre site for the retention/detention ponds equals approximately $11.5 million, whereas the overall costs of an equivalent PC area would equal approximately $1,370,000 (TC = $1,340,000 for 4.80 acres, MC 20YR = $26,756). If the reservoir were enlarged to capture the 25-year, 6-hour storm, the PC cost would be approximately $2,535,812 ($2,509,056.00 for 4.80 acres, MC 20YR = $26,756). Retention/detention ponds in this scenario cost approximately 78 to 89% more than the equivalent area dedicated to PC.
The bioretention area and infiltration basin data shown in Table 8 was calculated to determine the cost of each BMP on a comparable scale to a small pervious pavement structure for a drainage area of 5 acres or less. According to the design standards summarized in the Charlotte-Mecklenburg Stormwater BMP Design Manual, an infiltration basin or bioretention area has medium to high suitability for small rain events that meet the WQ V requirements for a 1-inch, 6-hour storm or the Channel Protection Volume (CP v) of a 1-year, 24-hour storm. For larger events, the infiltration basin or bioretention area will reach its design capacity quickly, and stormwater design measures must be taken to reroute stormwater to conventional storm drain systems. The calculated surface area, summarized in Table 8, for the infiltration basin at 2,741 square feet is nearly one-third the size of the calculated bioretention area of 9,894 square feet for the same design storm (1 inch). The overall cost, however, is higher for the infiltration basin at $106.98 per square foot, compared to $63.56 per square foot for the bioretention area. When compared to infiltration basins or bioretention areas, a PC structure of comparable sizes to each BMP would cost approximately $17,600 and $63,600, respectively. Overall PC costs for comparable structures to an infiltration trench and bioretention area would be 6% of the overall costs of the infiltration trench ($293,000), and 10% of the overall costs of bioretention areas. This significant difference in cost percentages between PC and bioretention areas/infiltration trenches is due in large part to a higher maintenance cost as well as the additional costs to purchase the land necessary to accommodate bioretention areas and infiltration trenches.
During this study, underground detention was not examined for cost comparison. However a study completed for the Charlotte Area Transit System for a proposed 2.87-acre parcel transit station that is located along Charlotte’s light rail corridor in the South End District estimated the cost for treating 2.2 acres of impervious area using cast-in-place concrete underground detention and sand filter at $855,155.00. This cost does not include any maintenance of the underground facility or the additional cost of any impervious pavement included in the site design. Using the square foot cost and designed to handle the 10-year storm, PC would cost approximately $963,894.20 ($10 per square foot + MC) to treat 2.2 acres of impervious surface, a difference of 11% or $108,739.20. Economy of scale was not factored in for the larger pervious concrete surface, which would be expected to be discounted.
At the time of this study, the suitability and pollutant removal capabilities were examined for four BMPs: detention ponds, wet retention ponds, bioretention, and infiltration basins. Permeable pavements were not listed in the Charlotte-Mecklenburg stormwater manual. As of July 2013, permeable pavement systems designed for infiltration are listed and given water-quality credit that equals the standard efficiency of bioretention and exceeds the standard efficiency of wet retention ponds.
The most cost-effective BMP to meet the water-volume requirements required in the Charlotte-Mecklenburg Stormwater BMP Design Manual according to the findings of this study is PC. And with the recent revisions, including water-quality credits for permeable pavement, it can also be the most effective BMP to meet water-quality requirements.
Conclusion
The results are compelling. Parking lots, driveways, and sidewalks account for 75% of the potential land area where permeable pavement could be installed and are typically privately owned. HydroCAD predictions for scenario 2 estimate approximately 55% reduction in peak flow for the 1.25-year rain event and approximately 37% reduction in peak flow for the 100-year event. The use of CN 61 is conservative and is based on a study by North Carolina State University that includes a high safety factor for longevity and maintenance efficiencies. However, the calculated CN for the Wilmore Walk project was less than CN 30.
The most effective BMP to meet water-volume and -quality requirements in urban areas with high land costs in typical Piedmont soils according to this study is pervious concrete pavement systems. If these surfaces were converted successfully over time, then significantly reducing and delaying stormwater runoff within the urban watershed thereby effectively reversing the history of urban hydrology is achievable.
References
Estes, Christopher J. 2009. “Stormwater Infiltration in Clay Soils: A Case Study in the North Carolina Piedmont.” Stormwater, January/February 2009.
Garrison, Noah and Karen Hobbs. 2011. Rooftops to Rivers II: Green Strategies for Controlling Stormwater and Combined Sewer Overflows. Natural Resources Defense Council, 2011. 134 pp.
Gray, Megan. 2013. “Effect of a Permeable Pavement Parking Lot on Runoff From the Irwin Creek Watershed in Charlotte, NC.” A Capstone Research Project Presented by Megan Gray, Department of Geography and Earth Sciences at the University of North Carolina at Charlotte, May 2013.
Kloss, Christopher and Crystal Calarusse. 2006. Rooftops to Rivers: Green Strategies for Controlling Stormwater and Combined Sewer Overflows. Natural Resources Defense Council, June 2006. 54 pp.
Potts, Andrew, Michele Adams, and Thomas Cahill. 2009. “A High-Density, Low Impact Development With Infiltration in a Limestone Area: The Village at Springbrook Farms.” American Society of Civil Engineers. http://ascelibrary.org/doi/abs/10.1061/41007%28331%2932.
Christopher J. Estes, PLA, ASLA, is president of Estes Design Inc., a consulting company in Charlotte, NC, that specializes in low-impact-development design and construction, stormwater quality, and environmental regulatory services.
